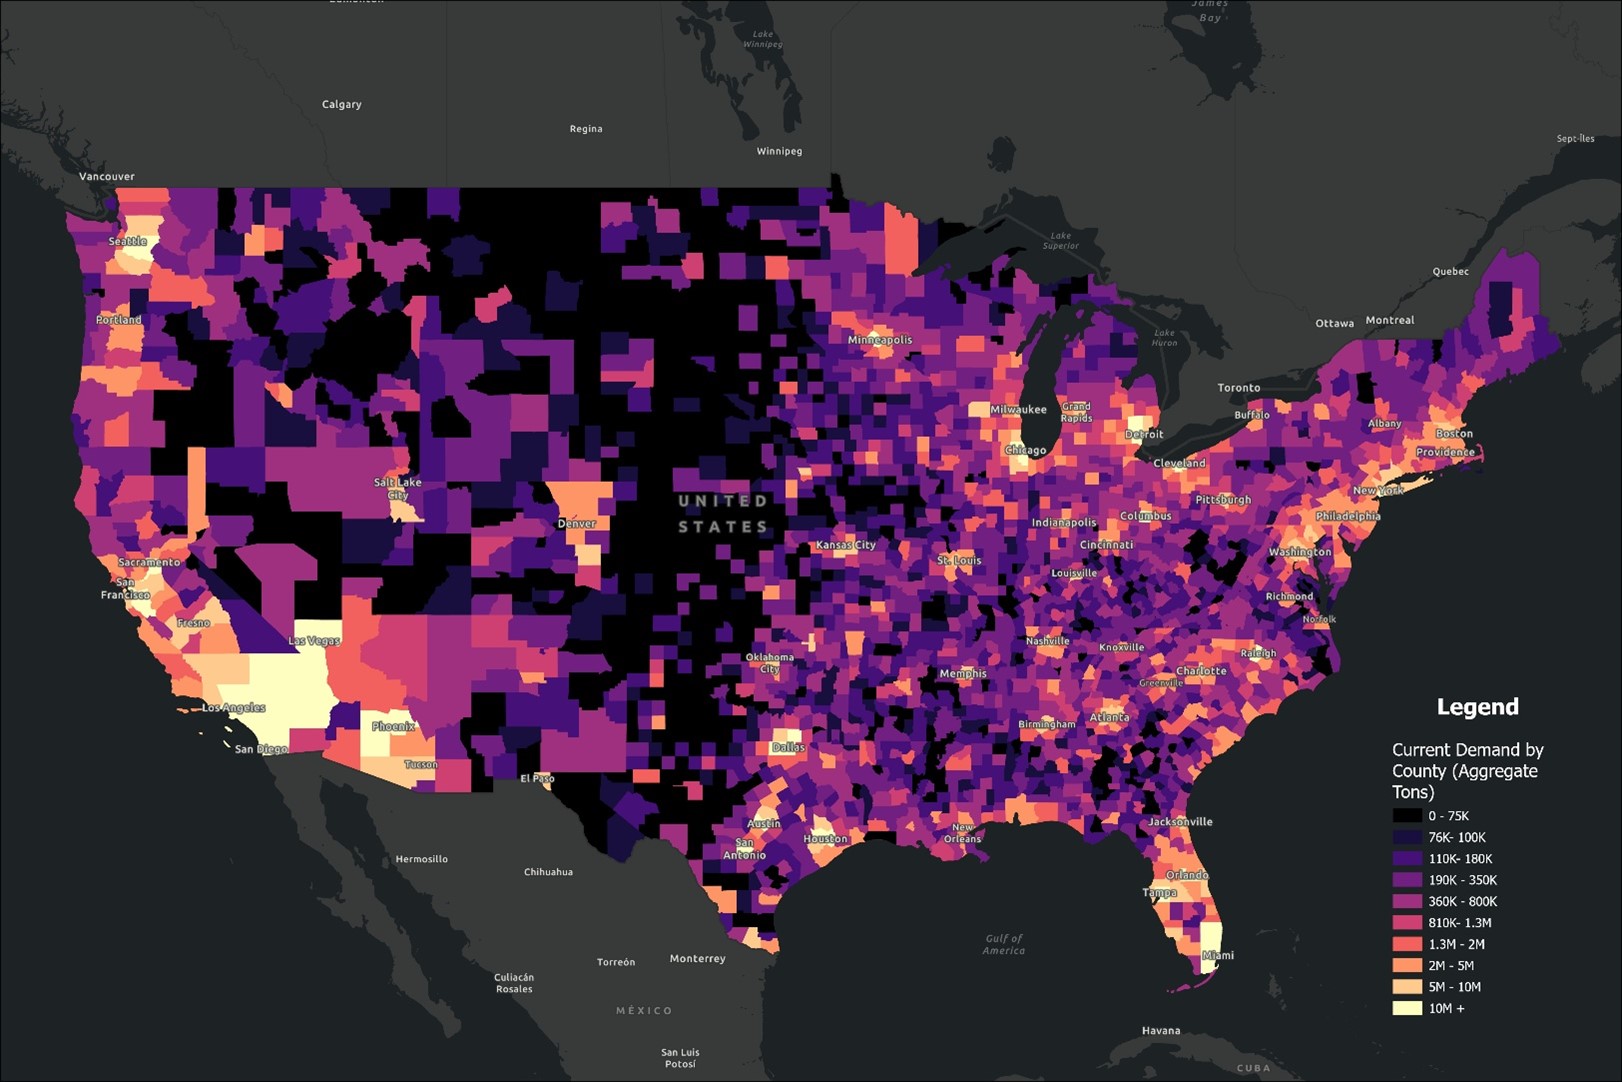
Explore the top 25 U.S. counties by estimated aggregate demand in 2024. Learn how construction trends, infrastructure investments, and population growth are driving demand for aggregates across key regions.
27 Aug, 23
David vs Goliath: How Local Aggregate Producers Compete with Global Heavyweights
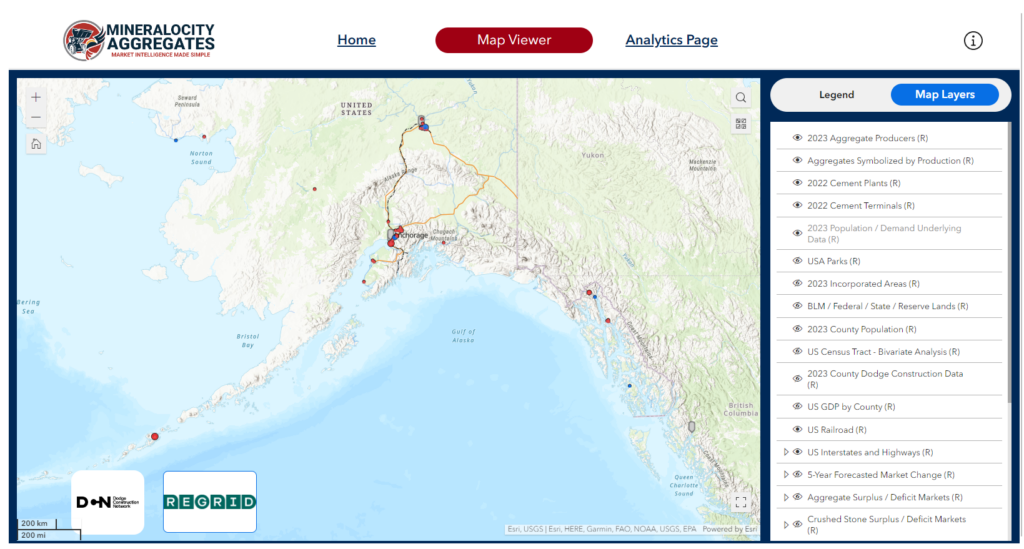
In a competitive landscape featuring global giants with vast resources, it may seem like an uphill battle for local aggregate producers to carve out a market share. However, states like Alaska show a unique market dynamic, where a diverse range of producers competes effectively. How do local companies stand their ground against these Goliaths? This article aims to uncover the secret sauce that allows smaller local firms to be a David in a world full of Goliaths.
The Case of Alaska: Diversity Defies Monopoly in Aggregate Producers
While aggregate markets in many regions tend to be dominated by a few large players, Alaska presents a unique case where no single company holds a monopoly. The competitive landscape is diversified, which is indicative of the region’s unique challenges and opportunities. Let’s look at the top three aggregate producers in Alaska:
Colas SA: 7% Market Share
Colas SA is a global powerhouse hailing from France, with diversified interests ranging from civil engineering to road building, railroads, and, of course, construction aggregates. The company’s broad expertise and international reach allow it to bring cutting-edge technologies and practices to Alaska’s aggregate market. Operating in a locale that has its own unique set of challenges—ranging from extreme weather conditions to logistics—Colas SA has proven its capability to adapt and innovate.
Anchorage Sand & Gravel Company Inc: 6% Market Share
With over 85 years of operational history, Anchorage Sand & Gravel Company Inc is deeply rooted in Alaska’s construction landscape. Based in Anchorage, most of their aggregate supplies come from the Palmer region and are transported via rail to their base. The company’s long history and local expertise make it a go-to choice for many Alaskan construction projects, both big and small. The company is likely to be one of the oldest aggregate producers in the state. Their local sourcing strategy also helps in reducing the carbon footprint and supports regional economic development.
Brice Incorporated: 6% Market Share
Brice Incorporated is another key player that adds to Alaska’s diverse aggregate market. Unlike Colas SA, Brice is a home-grown Alaskan business. Operating under the umbrella of Brice Companies, they offer a wide range of services from civil construction to marine services, equipment rentals, and quarry materials. Brice Incorporated stands out for its capability to complete projects in Alaska’s most remote locations, often under challenging conditions. The company’s reputation for delivering quality work on time and within budget has made it a preferred choice for many in the state.
Local producers can compete heavily with major national producers in Alaska, let’s explore why:
Geographic Challenges as an Equalizer of Aggregate Producers
In Alaska, the dispersion of population centers is not just a logistical hurdle; it’s a defining aspect of the local aggregate industry. The state’s sprawling landmass, punctuated by mountain ranges, rivers, and large swathes of unoccupied territories, makes it exceedingly challenging for any single entity to monopolize distribution. Unlike in the contiguous states, where major highways and extensive rail networks facilitate the rapid movement of materials, Alaska’s infrastructure is limited, often requiring a combination of road, rail, and even sea or air transport to reach remote areas.
Many of Alaska’s population centers are not only widely spaced but also highly isolated, sometimes accessible only by boat or plane. Such locations include small coastal communities, indigenous villages, and work camps for oil, gas, and mining operations. This isolation transforms logistics from a routine business consideration into a critical factor for the aggregate market. It’s not merely about getting the aggregate materials from Point A to Point B; it’s about overcoming a gauntlet of geographic, climatic, and infrastructural challenges that can fluctuate seasonally, or even daily.
As a result, the ability of local aggregate producers to adapt quickly and offer more tailored services becomes a significant competitive advantage. They can often provide materials with shorter lead times and more customized delivery plans than larger corporations, which may not be as attuned to Alaska’s unique challenges. In essence, the state’s geography serves as an equalizer, fostering a more diverse landscape of aggregate producers and offering opportunities for local businesses to carve out their own specialized niches.
Low Overhead: The David's Sling
Another advantage local companies have is lower overhead costs. These companies can be nimble, allowing them to pop up where smaller-scale production meets market demands, which can be cost-prohibitive for major players.
Strategies for Local Aggregate Producers
Focus on Niche Markets
As seen in states like Idaho and Nevada where the top producers only have a market share of around 9%, local companies can compete by specializing in niche markets or products that bigger companies might overlook. Many small, yet growing markets may have not yet reached a level where the major players consider it worth investment.
Leverage Local Relationships
Companies like Anchorage Sand & Gravel and Brice Incorporated in Alaska use their local relationships to secure long-term contracts that may not be as accessible to global firms who aren’t as familiar with local community needs and business culture.
Agility and Quick Decision-making
Local producers can often make quicker decisions without going through layers of corporate bureaucracy. This agility allows them to adapt rapidly to market changes, be it fluctuating demand or disruptions in supply chains.
Case Studies from Other States
While Alaska offers a compelling example of a market where no single aggregate producer holds a monopoly, it is far from being an outlier. Several other states, including Arizona and Colorado, similarly demonstrate diverse market shares among top producers. This diversity provides a conducive environment for both local and national businesses to operate and grow. Below, we delve into the unique market landscapes in Arizona and Colorado.
Arizona: A Blend of National and Local Powerhouses
In Arizona, the aggregate market is characterized by a blend of both national and local producers. Companies like Vulcan Materials and Cemex share the space with Arizona-based businesses such as Superstition Crushing. The state’s growing urban centers, like Phoenix and Tucson, provide a robust demand for aggregates, making it a lucrative market for various players. Additionally, the state’s focus on sustainable sourcing practices offers opportunities for businesses to incorporate eco-friendly operations.
Colorado: Geographical Diversity Spurs Market Fragmentation
Colorado’s aggregate market is fragmented, much like its varied geography. With regions ranging from the Rocky Mountains to the Eastern Plains, the state has a diversified set of aggregate needs. This diversity allows companies specializing in different types of aggregates to co-exist and thrive. Companies like Martin Marietta and LafargeHolcim find themselves competing with local producers like Whitewater Building Materials Corp. Moreover, the state’s investment in infrastructure projects provides a constant demand, creating room for new entrants.
Opportunities for Local Businesses
The case studies of Arizona and Colorado underscore that opportunities abound for local businesses to gain a foothold in the market. These states, much like Alaska, demonstrate that market diversity and competitiveness can be the norm rather than the exception. Entrepreneurs and small to mid-size businesses can take inspiration from these markets to develop strategies tailored to local conditions, whether it be through specializing in a specific type of aggregate or through adopting sustainable practices that resonate with local demand.
Conclusion
While the competition is fierce, and the opponents are massive, the story of David vs Goliath is alive and well in the aggregate industry across the United States. From Alaska to Arizona, local firms can employ a range of strategies to compete effectively against global heavyweights. In an industry that often seems dominated by giants, there’s still room for the smaller players to not only survive but thrive.
Interested in diving deeper into this topic? Check out Mineralocity Aggregates, a cutting-edge platform offering comprehensive market intelligence, including insightful data on how local and global companies are competing in every state. Check out our Top Aggregate Producers Report to learn more about the top producers in each US state.
Unlock exclusive, groundbreaking market data with the 2022 Top Aggregate Producers Report. Don't miss out!
Gain a competitive edge with our 2022 Top Aggregate Producers Report! Get exclusive market share data on top producers in each U.S. state with market trends to strategize effectively. A must-have for every industry player!
27 Aug, 23
Size Doesn’t Matter: How Connecticut and New Jersey Punch Above Their Weight in Aggregate Production
When it comes to aggregate production, bigger isn’t always better. While states like Texas and California garner much attention due to their large geographical size and abundant resources, smaller states like Connecticut and New Jersey consistently show impressive aggregate production figures. But how is it possible for these smaller states to compete with the bigger players? The answer lies in a combination of factors, including efficiency, quality, and strategic location.
Efficiency: Making the Most Out of What You've Got
Connecticut, for example, is a small state with a total aggregate production of 14,991,416. What makes this number truly noteworthy is the market share of the top producers, with CRH PLC holding 43%, O & G Industries Inc at 8%, and Rawson Materials Inc. at 7%. Despite having limited land area and resources, these companies have honed their operations to an art, squeezing every bit of value out of the materials they produce.
Quality Over Quantity: The Caliber of Aggregates
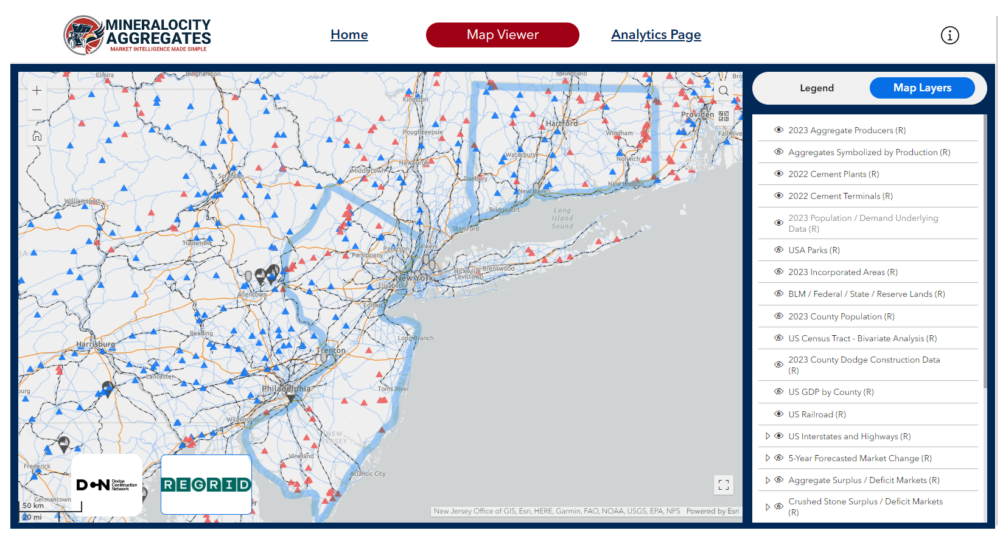
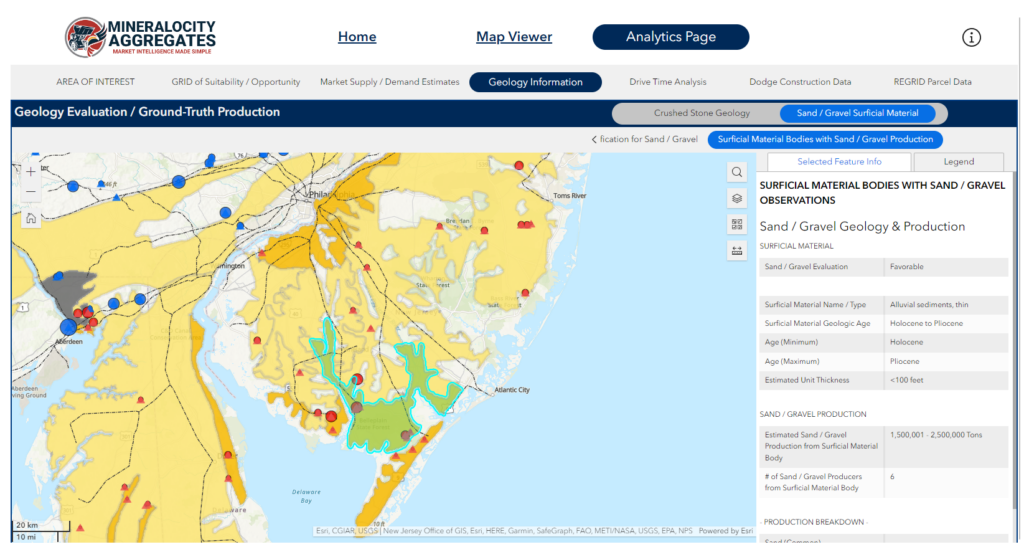
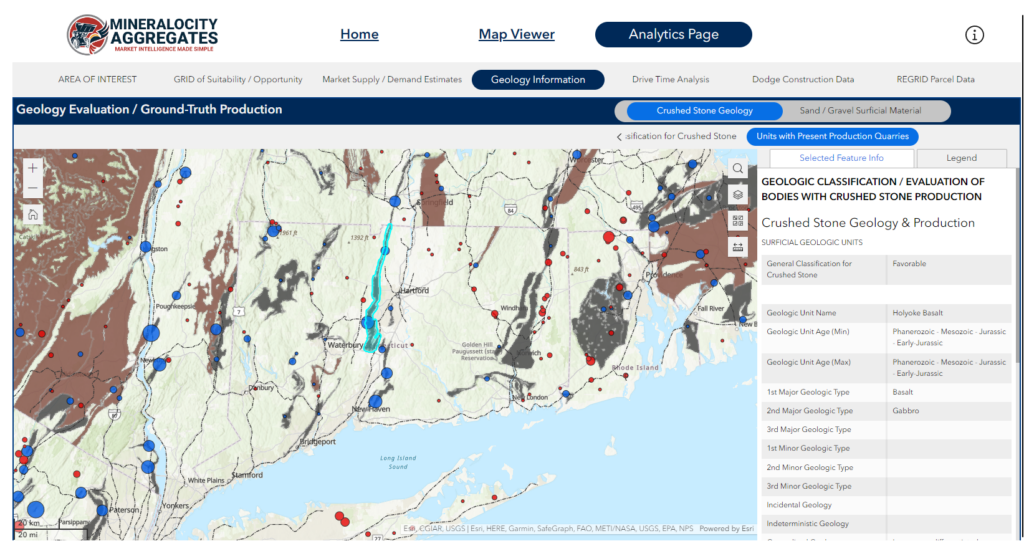
In both Connecticut and New Jersey, the quality of aggregates is another key factor that allows these states to punch above their weight. Superior geological formations offer high-quality materials that often fetch higher market prices, making these states competitive in a crowded market. New Jersey has an abundance of quality sand and gravel resources, while Connecticut has quality crushed stone available throughout narrow geological bands throughout the state. Both are illustrated within the Mineralocity Aggregates platform and shown in the screenshots below:
Strategic Exporting: Leveraging Geographic Location and Economic Relationships
When discussing the aggregate production success of states like Connecticut and New Jersey, it’s important to understand their economic ties with neighboring regions. This interconnectedness not only adds another layer to their capability to produce and export aggregates but also makes them key players in the broader economic landscape.
New York’s Economic Magnetism
Both New Jersey and Connecticut are deeply connected to New York, particularly New York City, the economic hub of the region. With a large commuting population traveling for work between these states and the city, there’s a constant flow of economic activity. Companies such as MetLife, Prudential Financial, and Johnson & Johnson are Fortune 500 entities headquartered in New York City, but they also have significant operations and workforce in New Jersey and Connecticut. Moreover, New Jersey serves as a major transportation hub for New York, and the Port of Newark is among the busiest ports in the United States. This facilitates the smooth transfer of aggregate materials to various markets.
Pennsylvania: The Border Trade Advantage
Pennsylvania is another vital partner that shares long borders with New Jersey and Connecticut. As major suppliers of goods and services, including aggregates, to Pennsylvania-based businesses, these states experience a beneficial economic interchange. The shared borders also mean that Pennsylvania is a notable tourist destination for people residing in both New Jersey and Connecticut, which indirectly boosts the aggregate demand for infrastructure projects. It should be noted that Pennsylvania is also a major aggregate producer for its size with an annual estimated 2022 production of over 105 million tons.
Massachusetts: The Sectoral Synergy
Though smaller in size, Massachusetts commands significant economic importance. It is home to corporations that are giants in sectors such as life sciences, technology, and finance, like Boston Scientific and Fidelity Investments. Collaborative efforts between Massachusetts and New Jersey or Connecticut businesses are frequent, particularly in these specialized sectors. This kind of cross-border investment and collaboration extends to the aggregate industry, where the high-quality aggregates from Connecticut and New Jersey find lucrative markets.
Rhode Island: The Small Giant
Rhode Island may be the smallest New England state, but it has a significant economic footprint, hosting Fortune 500 companies like CVS Health and The Providence Journal. The sectors of manufacturing, tourism, and healthcare see particularly strong collaborations between Rhode Island and New Jersey or Connecticut businesses, creating an avenue for aggregate material exchange and investment.
Beyond the Borders
While the closest and most robust economic relationships are with neighboring New England states, New Jersey and Connecticut are not limited to these borders. Their reach extends nationally and even globally, but it’s this local interconnectedness that significantly fuels their impressive aggregate production figures.
The Future is Bright: Sustainable Practices
Both states have adopted sustainable aggregate production methods, such as recycling old concrete into new aggregate, that not only reduce the environmental impact but also contribute to efficiency.
Conclusion
The tale of Connecticut and New Jersey serves as a lesson that size doesn’t always matter. It’s a mix of efficiency, quality, and location that makes these states stand out. If you’re intrigued by these insights and want to know who else is making waves in the aggregate industry, don’t miss our Top Aggregate Producers Report for 2023. Discover how companies like Mineralocity Aggregates are shaping the future of aggregate production.
Unlock exclusive, groundbreaking market data with the 2022 Top Aggregate Producers Report. Don't miss out!
Gain a competitive edge with our 2022 Top Aggregate Producers Report! Get exclusive market share data on top producers in each U.S. state with market trends to strategize effectively. A must-have for every industry player!
26 Aug, 23
4 U.S. Counties Poised for Explosive Growth in Construction Aggregate Demand
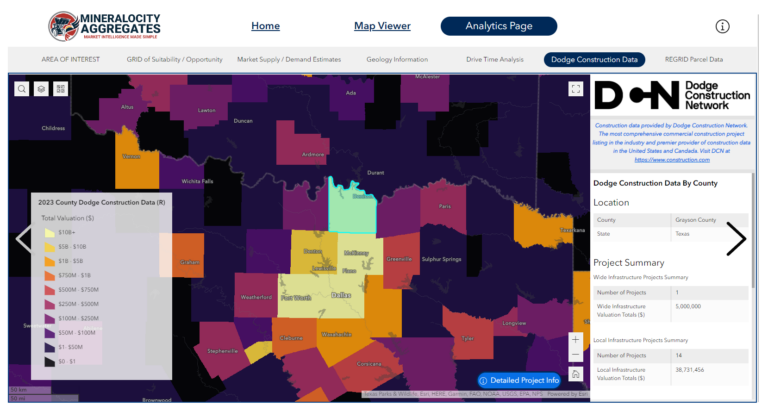
When it comes to the construction aggregate industry, knowing where to focus your attention and resources can be half the battle. Thanks to exclusive data from Dodge Construction Network, and rigorous analysis on the Mineralocity Aggregates platform, we’re spotlighting four U.S. counties where future demand for construction aggregates is poised to skyrocket.
Grayson County, Texas
Total Projects: 92
Total Valuation: $30 Billion
- Wide Infrastructure Projects: 1 ($5 Million)
- Local Infrastructure Projects: 14 ($38.73 Million)
- Local Non-Residential Projects: 77 ($29.99 Billion)
Grayson County is a hidden gem, with a total valuation of $30 billion in potential projects, setting the stage for immense construction aggregate demand in the near future.
San Bernardino County, California
Total Projects: 991
Total Valuation: $20.37 Billion
- Wide Infrastructure Projects: 6 ($439 Million)
- Local Infrastructure Projects: 40 ($519 Million)
- Local Non-Residential Projects: 945 ($19.4 Billion)
San Bernardino is a hive of construction activity with almost a thousand projects valued at over $20 billion. It’s a potential goldmine for construction aggregate suppliers.
Maricopa County, Arizona
Total Projects: 2,319
Total Valuation: $106.64 Billion
- Wide Infrastructure Projects: 70 ($887 Million)
- Local Infrastructure Projects: 202 ($901 Million)
- Local Non-Residential Projects: 2,047 ($105 Billion)
In Maricopa, the numbers are staggering. With a colossal valuation exceeding $106 billion, this county is on the cusp of unprecedented growth in construction aggregate demand.
Cook County, Illinois
Total Projects: 710
Total Valuation: $77 Billion
- Wide Infrastructure Projects: 28 ($347 Million)
- Local Infrastructure Projects: 166 ($422 Million)
- Local Non-Residential Projects: 516 ($76.2 Billion)
Cook County’s diversity in project types and a valuation of $77 billion make it a hotbed for construction aggregate demand, ranging from infrastructural to non-residential projects.
Construction data provided by Dodge Construction Network. The most comprehensive commercial construction project listing in the industry and premier provider of construction data in the United States and Canada. Visit DCN at https://www.construction.com
This invaluable data has been exclusively analyzed on the Mineralocity Aggregates platform and mapped out for every U.S. county to forecast future construction aggregate-intensive projects—projects that haven’t yet started but have a high likelihood of occurring.
Ready to Unlock the Future of Construction Aggregate Demand?
These are just a few examples. Imagine the opportunities waiting to be discovered nationwide! With a subscription to Mineralocity Aggregates, you gain access to an incredibly powerful tool designed to identify potential areas of growth and future construction aggregate demand. What are you waiting for? Dive into a world of opportunity. Book your live demo now. Don’t miss your chance to be ahead of the curve.
Unlock exclusive, groundbreaking market data with the 2022 Top Aggregate Producers Report. Don't miss out!
Gain a competitive edge with our 2022 Top Aggregate Producers Report! Get exclusive market share data on top producers in each U.S. state with market trends to strategize effectively. A must-have for every industry player!
26 Aug, 23
The Correlation Between Market Share and State Production & Size in the Construction Aggregate Industry
The construction aggregate industry is the unsung hero of the building world, playing a vital role in the production of everything from roads to skyscrapers. Despite its foundational importance, the industry is often misunderstood or overlooked by those outside it. One of the most intriguing aspects of the construction aggregate industry is the way market share and state production interact. While state production figures provide us with an idea of the total output of aggregates, the market share helps to understand how concentrated or fragmented the market is. Understanding the relationship between these two factors is crucial for both seasoned experts and industry novices. It can reveal growth opportunities and present a clearer picture of the industry landscape. Utilizing exclusive data from Mineralocity Aggregates and backed by thousands of hours of market research and analysis, this article will explore some of the dynamic between market share of the top state producers and total state production / state size to see if a correlation can be established.
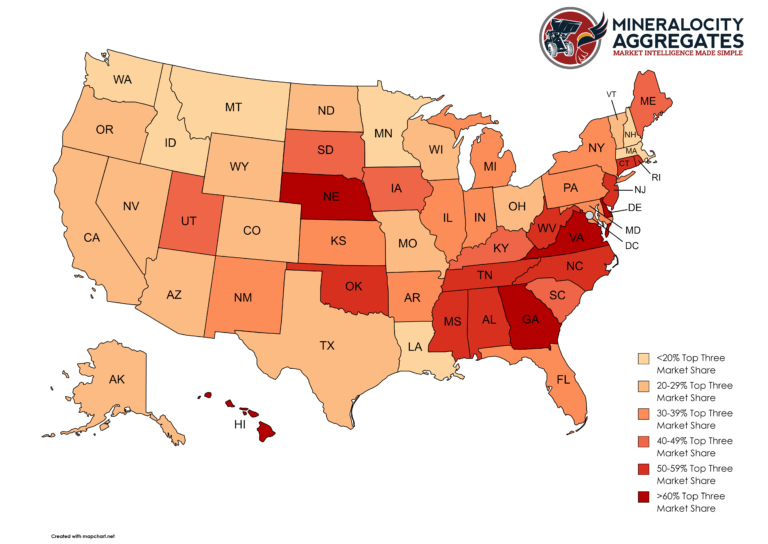
The Market Share Data Snapshot by Total State Aggregate Production
Before delving into the topic, let’s take a brief look at some key data points:
- Alabama: 60,075,895 total state production, Top producers market share: 54%
- Alaska: 7,484,685 total state production, Top producers market share: 24%
- California: 158,732,640 total state production, Top producers market share: 20%
- Connecticut: 14,991,416 total state production, Top producers market share: 58%
This is just a snapshot, but it begins to tell a compelling story.
The Market Share Correlation between Total State Production and Top Producers Market Share
High Production, Low Market Share
States like California have high production but surprisingly low market share for top producers. This suggests a more fragmented market where multiple players compete. Such landscapes often offer room for newer entrants and innovative solutions.
Low Production, High Market Share
In contrast, states like Connecticut, with 14,991,416 in total state production and a staggering 58% market share for the top producers, indicate a concentrated market. Here, new entrants will find it challenging to carve a niche. The high market share also often points to mature markets where the top players have significant leverage.
Balanced Production and Market Share
States like Alabama present a balanced picture, with a total state production of 60,075,895 and top producers controlling 54% of the market. This balance suggests that while there are dominant players, there’s still room for competition and growth.
Regional Dynamics and State Policies
The correlation is also influenced by regional dynamics and state policies. For example, the lower market share in states with high production could be a result of favorable policies that encourage competition. On the other hand, high market share in states with low production could signal strict regulations that create barriers to entry.
The Business Implications
Understanding this correlation can provide invaluable insights for business decisions:
- For Investors: Knowing which states have a balanced market share and production ratio could identify the most secure investment opportunities.
- For Existing Companies: High market share in states with high production could indicate saturated markets. Diversification might be an effective strategy.
- For New Entrants: States with high production but low market share for top producers could present untapped opportunities.
An Alternative Theory: Market Share in Relation to State Size: A New Perspective on Aggregate Production
While aggregate production is undeniably influenced by factors like market demand, availability of raw materials, and economic conditions, the role of geographic size has not likely been explored previously. Given the logistical requirements associated with the mining and transport of construction aggregates, the size of a state could be a noteworthy factor that correlates with market share distribution among top producers.
Methodology
To explore this correlation, we juxtapose data on total state production and top producer market share against the geographic size of the state. States with larger land areas may experience higher costs associated with transportation, potentially affecting the distribution of market share. Conversely, smaller states may have a more even spread among top producers due to shorter transit distances and thus, lower logistical costs.
Findings
The correlation between total state size and top three producer market share appears to be stronger than the correlation between market share and total state aggregate production. This could be attributed to a number of factors, including transportation logistics and market reach of individual operations.
States with Larger Geographic Size:
- Texas 268K Mi²: Despite being one of the largest states by area, the market share among top producers is fairly distributed, with the largest producer holding only 9%. This may be due to the significant transportation distances, leading to regional monopolies rather than a single dominant player.
- California 163K Mi²: Similar to Texas, the market share in California is evenly distributed, even though it’s a large state with diverse geological features. The highest market share is 9%.
- Alaska 665K Mi²: As one of the largest states, Alaska has surprisingly low market share concentration, with the top producer holding only 11% of the market. The vast geography and complex logistics could be contributing factors – leading to many smaller independent operations instead of regional concentration.
States with Smaller Geographic Size:
- Delaware 2K Mi²: Being one of the smallest states, Delaware has a high market share concentration with the top producer holding 29% and a total of 68% market share for the top three.
- Connecticut 5K Mi²: Also a smaller state, Connecticut shows a high concentration of market share with the leading producer holding 43%.
- Rhode Island 1K Mi²: In this tiny state, market concentration is incredibly high, with the leading producer holding 32% of the market and a total market share of 58% among the top three producers.
Implications
Logistical Costs: In larger states, the logistical costs associated with transporting aggregates seem to dilute the market share of top producers and reduce the reach of each operation, requiring smaller (often independent) operations to fill the gaps.
Regional Monopolies: In larger states, it’s more likely for regional monopolies of multiple operations to exist rather than a single dominant player across the state.
High Concentration in Smaller States: The top producers in smaller states tend to have higher market shares, potentially due to lower logistical constraints and less area to cover with a single operation.
Strategic Planning: Understanding this correlation can help companies plan better for scale, market entry, or operational efficiency based on the state’s geographic size.
Conclusion
While the data points to an interesting and potentially stronger correlation between state size and market share, it’s essential to recognize that other variables such as demand, state policies, and economic conditions are also in play. However, the role of geographic size in shaping market share dynamics offers a unique lens for industry analysis, which could be particularly valuable for strategic planning.
Want to take a deeper dive into the data? Get your hands on the report that industry veterans are calling a “must-read for any serious player in the aggregate market.” Download the Mineralocity Aggregates 2022 Top Aggregate Producers Report now, and step into the future of construction aggregate business with confidence.
Unlock exclusive, groundbreaking market data with the 2022 Top Aggregate Producers Report. Don't miss out!
Gain a competitive edge with our 2022 Top Aggregate Producers Report! Get exclusive market share data on top producers in each U.S. state with market trends to strategize effectively. A must-have for every industry player!
26 Aug, 23
The Dynamics of Market Concentration in the Construction Aggregate Industry
Introduction
When it comes to the construction aggregate industry, the distribution of market share among leading companies can reveal much about the state of competition, barriers to entry, and opportunities for innovation. Using exclusive and proprietary data from Mineralocity Aggregates, this article sheds light on the dynamics of market concentration in the industry across different U.S. states. Specifically, we examine the contrast between states with highly concentrated markets—dominated by a handful of key players—and those with more fragmented landscapes.

High Concentration Markets in the Construction Aggregate Industry: The Few Rule the Many
Case Study: Hawaii
In Hawaii, the top three construction aggregate producers—HC&D, LLC, Hawaiian Cement, and West Hawaii Concrete—collectively hold a staggering 90% of the state’s market share. This level of concentration not only demonstrates the grip these companies have on the market but also raises questions about barriers to entry for new players.
Case Study: Nebraska
Similarly, in Nebraska, Martin Marietta Materials, Inc., Kerford Limestone Company, and CRH PLC control 77% of the market. Such a tight grip by a few companies often leads to fewer choices for consumers and could potentially affect pricing strategies.
Case Study: Rhode Island
In Rhode Island, J.R. Vinagro Corporation, Holliston Sand Company Inc, and CRH PLC dominate 58% of the market, again pointing toward high concentration. Here, the influence of these key players is evident not just in their market share but also in their capacity to shape industry trends and practices.
Fragmented Market Concentration in the Construction Aggregate Industry: The Many Rule Themselves
Case Study: Alaska
On the other end of the spectrum, Alaska’s construction aggregate market presents a contrasting picture. Here, the top three producers—Colas S A, Anchorage Sand & Gravel Company Inc, and Brice Incorporated—capture just 24% of the market. This low concentration suggests a more open market landscape, where smaller players can compete more effectively.
Case Study: Minnesota
In Minnesota, the three leading companies—Holcim Group, Martin Marietta Materials, Inc., and MDU Resources Group Inc—account for a mere 12% of the market. Such a fragmented market often encourages innovation and competition, offering more choices to consumers.
Case Study: Montana
Montana mirrors this trend with MDU Resources Group Inc, United Materials of Great Falls, Inc., and Fisher Sand & Gravel Company also holding only 12% of the market share. These statistics indicate that there are likely fewer barriers to entry and possibly more room for disruptive innovation in the state.
Conclusion
Market concentration in the construction aggregate industry across the U.S. is a tapestry of concentrated and fragmented markets, each with its own unique challenges and opportunities. While highly concentrated markets may present fewer opportunities for new entrants, they often indicate a level of stability that could be attractive to investors. On the other hand, fragmented markets could be hotbeds for innovation and diversification.
Whatever the level of market concentration in the construction aggregate industry, understanding these dynamics is crucial for anyone involved in the industry. For those looking for more in-depth analysis, the full report, available for free download, provides comprehensive insights to help you explore growth opportunities, enhance operations, and boost profitability in this demanding market.
Unlock exclusive, groundbreaking market data with the 2022 Top Aggregate Producers Report. Don't miss out!
Gain a competitive edge with our 2022 Top Aggregate Producers Report! Get exclusive market share data on top producers in each U.S. state with market trends to strategize effectively. A must-have for every industry player!

25 Aug, 23
The Titans of the Aggregate Industry: Top Aggregate Producers in the US
Introduction
The aggregate industry is an essential part of America’s infrastructure. With every road, bridge, and building, aggregates—such as sand, gravel, and crushed stone—are required to lay a solid foundation. The production of these aggregates is a significant business in the United States, with companies competing fiercely for their share of the market. In this article, we delve into the top aggregate producers in the US, spotlighting the companies that lead the way in each state and examining the heavyweights that dominate the industry on a national scale.
Construction Aggregate Heavyweights
The latest data from Mineralocity Aggregates reveals that certain names appear recurrently as top producers across multiple states, earning them a notable place among the top aggregate producers in the US. The following is a breakdown of how frequently each of the major players has secured a top-three position among aggregate producers in various states:
Vulcan Construction Materials, LLC – Second Place with Syar Acquisition
- Number of Top-Three Appearances Across States: 12 (15 with Syar Acquisition)
- Notable States of Dominance: Alabama, Florida, Georgia, Texas
- Recent Acquisitions: In 2022, Vulcan acquired Syar Industries Inc., further expanding its foothold in states such as Arizona and California.
- Insight: Vulcan Construction Materials has cemented its role as an industry titan, consistently producing massive quantities of high-quality aggregates.
Martin Marietta Materials, Inc. – Neck and Neck with Vulcan
- Number of Top-Three Appearances Across States: 12
- Notable States of Dominance: Iowa, Nebraska, North Carolina, Colorado
- Insight: Martin Marietta Materials, with its strategic reserves and commitment to quality, is a significant force among the top aggregate producers in the US, securing a prominent place in numerous states.
CRH PLC – The Reigning Champ
- Number of Top-Three Appearances Across States: 22
- Notable States of Dominance: Connecticut, Delaware, New Jersey, Pennsylvania
- Insight: As a global building materials company, CRH PLC maintains a strong presence in the U.S., particularly in the Northeast and Mid-Atlantic regions, where it is a leading producer of aggregates.
Honorable Mention – Holcim
- Number of Top-Three Appearances Across States: 6
These companies, due to their extensive operations and aggressive growth strategies, have a remarkable standing across multiple states. Whether through the acquisition of smaller companies, like Vulcan’s 2022 purchase of Syar Industries, or through organic growth and superior operational efficiency, these heavyweights are shaping the landscape of the American aggregate industry.
A Regional Perspective on the Top Aggregate Producers in the US
In the South: Vulcan Construction Materials, LLC is a leading producer among the top aggregate producers in the US, dominating in states such as Alabama, Florida, and Texas. This company alone produced over 29 million tons of aggregate in Texas and over 31 million tons in Georgia.
In the Midwest: Martin Marietta Materials, Inc. stands as a dominant force among the top aggregate producers in the US, with the top rank in states like Iowa and Nebraska, producing over 16 million tons in Iowa alone.
In the Northeast and Mid-Atlantic: CRH PLC, a global building materials company, takes a leading role among the top aggregate producers in the US, particularly in states like Connecticut, Delaware, and New Jersey
What Drives the Success of These Titans Among the Top Aggregate Producers in the US?
There are several factors at play here. These companies have secured extensive reserves of high-quality materials, sophisticated processing technology, strategic locations near growing markets, and a longstanding reputation for reliability and quality. In addition, these giants often engage in acquisitions, thereby extending their reach and capacity, and solidifying their status among the top aggregate producers in the US.
The Implications of the Dominance of the Top Aggregate Producers in the US
The dominant position of these companies has implications for both the industry and consumers. Their extensive operations can drive efficiencies and innovations that may benefit the end-users of aggregates. However, their dominance also raises questions about competition and the ability for smaller players to thrive in this vital sector, which is so heavily influenced by the top aggregate producers in the US.
A Glimpse at Local Players
While the industry giants play a significant role, it’s essential not to overlook the local or regional producers who are critical to their respective states. For instance, HC&D, LLC is the top producer in Hawaii. Syar Industries Inc was a leading producer in states such as Arizona and California until its acquisition by Vulcan Construction Materials in 2022. This acquisition is a recent example of how top-tier companies are expanding their footprint, often by absorbing successful local and regional operators.
Conclusion
As America continues to grow, so does its need for aggregates. The titans of the aggregate industry—Vulcan Construction Materials, LLC, Martin Marietta Materials, Inc., and CRH PLC—are at the forefront of this demand, producing millions of tons of aggregates to support the construction of roads, bridges, and buildings across the nation. They are not just major players; they are among the top aggregate producers in the US.
However, the landscape is as diverse as the country itself, with local and regional producers playing a significant role in their respective states. As the industry evolves, it will be fascinating to see how these companies, including the top aggregate producers in the US, adapt, innovate, and continue to build the literal foundation of America.
Unlock exclusive, groundbreaking market data with the 2022 Top Aggregate Producers Report. Don't miss out!
Gain a competitive edge with our 2022 Top Aggregate Producers Report! Get exclusive market share data on top producers in each U.S. state with market trends to strategize effectively. A must-have for every industry player!

25 Aug, 23
Top Aggregate Producing States: Texas and Georgia in 2022
In 2022, as the nation strove for economic recovery and revitalization of infrastructure, the aggregate industry in the United States proved itself more than just a backbone—it emerged as a vital force in national construction efforts. Aggregates, the sand, gravel, and crushed stone used to build the roads, bridges, and buildings we rely on every day, are an unsung hero of American industry. In this context, two states — Texas and Georgia — have demonstrated exceptional prowess as top aggregate producing states, leading the way with staggering production figures, and setting the gold standard for other states to follow. Texas is king, by a long shot, but Georgia (while not in the #2 spot on production) has stood out as a notable and growing producer.
This isn’t just about rocks and numbers. It’s about economic health, job creation, and sustainable development, where meeting today’s demands doesn’t compromise the needs of tomorrow. It’s about the livelihoods of countless individuals whose efforts in these key states reverberate across the nation.
Behind every mile of highway, every modern office building, and every growing community lies the story of aggregates. And in 2022, Texas and Georgia were writing captivating chapters of this story. Here, we dive into the data, explore the leading producers, and uncover the secrets of their success.
Texas: The Lone Star Leads the Nation
In 2022, Texas was the nation’s top aggregate producer, with a staggering total of 315 million tons produced throughout the year. It maintained impressive production figures across all four quarters, despite a 15.7% seasonal decrease in the fourth quarter.
Top Aggregate Producers in Texas (2022)
- Vulcan Construction Materials: Approximately 29 million tons
- Martin Marietta Materials: Approximately 28 million tons
- Heidelberg Cement AG: Approximately 21 million tons
These titans of industry play a critical role in Texas’ substantial output, powering both the state’s infrastructure projects and its economy.
Georgia: The Peach State's Solid Production
Georgia, another leading state in aggregate production, reported a total of nearly 80 million tons in 2022. Unlike other states, Georgia reported growth in three of the four quarters, with a notable 13.5% increase in the third quarter. On production numbers alone there are several other states between Georgia and Texas, but the solid growth of aggregate demand in the peach state tells a compelling story.
Top Aggregate Producers in Georgia (2022)
- Vulcan Construction Materials: Approximately 32 million tons
- Martin Marietta Materials: Approximately 11 million tons
- Imerys S.A.: Approximately 7 million tons
These leading producers significantly contribute to Georgia’s rank as a top aggregate producing state, supporting major construction projects throughout the region.
What Drives These Exceptional Figures?
Several factors contribute to Texas and Georgia’s leading positions in aggregate production:
Abundant Natural Resources: Texas has vast reserves of limestone, while Georgia is rich in granite deposits and has a great supply of high-quality sands across the Coastal Plain.
Strategic Locations: Proximity to major construction markets, such as Houston in Texas and Atlanta in Georgia, plays a pivotal role.
Dominant Industry Players: Companies like Vulcan Construction Materials, Martin Marietta Materials, and CRH PLC operate extensively in these states, bolstering high production figures.
Economic Impact and National Perspective
The scale of production in Texas and Georgia has broader economic implications. In Texas, the aggregate industry generated billions in revenue, a testament to the critical role aggregates play not only in construction but in the economic health of the state itself.
Nationally, the total U.S. aggregate production in 2022 was reported at 2.44 billion metric tons, despite a 7.4% decrease in the fourth quarter. This national figure underscores the significance of top-producing states like Texas and Georgia in the broader U.S. context.
Conclusion
As America’s infrastructure continues to evolve and expand, the demand for aggregates shows no sign of slowing. States like Texas and Georgia, with their robust production figures, exemplify the pivotal role that aggregates play in our nation’s growth. These states, led by prominent producers such as Vulcan Construction Materials, LLC in the South and Martin Marietta Materials, Inc. in the Midwest, have set a remarkable standard.
This growth story is not just about tons of aggregate produced; it’s a narrative of innovation, resilience, and sustainable development—a narrative that will undoubtedly continue to shape America’s future. With dynamic players like CRH PLC in the Northeast and Mid-Atlantic regions, the competitive landscape promises exciting developments ahead.
Where do these trends lead, and what new strategies will industry titans and smaller players alike adopt in response to the changing needs of our growing nation? These questions are vital for anyone involved in or tracking the construction and aggregate industries.
For a deeper dive into the data that paints this compelling picture, Mineralocity Aggregates is your go-to source. With comprehensive, up-to-date information and insightful analysis, Mineralocity Aggregates provides the resources industry professionals need to stay ahead of the curve. From detailed production figures to in-depth profiles on top producers, the data that shaped this article and so much more is readily available for you at Mineralocity Aggregates.
To access the complete list of top aggregate producers in each state and explore more exclusive insights, download our exclusive report from Mineralocity Aggregates.
Unlock exclusive, groundbreaking market data with the 2022 Top Aggregate Producers Report. Don't miss out!
Gain a competitive edge with our 2022 Top Aggregate Producers Report! Get exclusive market share data on top producers in each U.S. state with market trends to strategize effectively. A must-have for every industry player!
09 Aug, 23
Expanding Aggregate Production to New Regions: Pros and Cons
The construction aggregate industry is vast, and with urbanization and infrastructure development on the rise globally, the demand for quality aggregates continues to grow. But is expanding aggregate production to new regions the right move for every producer? Branching out to unfamiliar territories offers a mix of potential benefits and challenges. In this article, we’ll delve into the pros and cons of extending your aggregate operations into new regions, helping you weigh your options with clarity.
Pros of Entering a New Region as an Aggregate Producer:
Increased Market Share and Revenue Streams
When considering expanding aggregate production to new regions, the potential for increased market share stands out. Entering a new region allows businesses to tap into unexplored markets, positioning themselves in front of a whole new set of potential clients. This move can lead to a significant increase in market share. Furthermore, different regions might have varying needs, which offers a chance for product diversification. Such diversity can lead to multiple revenue streams, ensuring stability even if one market segment witnesses a downturn.
Leveraging Economies of Scale
Expanding aggregate production to new regions means scaling up production volumes. As these volumes increase, companies can achieve greater economies of scale. This economic principle indicates that as production grows, the cost per unit goes down. This reduction is primarily due to the spread of fixed costs like machinery and infrastructure over more units. These efficiencies can translate into competitive pricing in the new market. Additionally, a broader operational base can lead to bulk procurement discounts, driving costs even lower.
First-mover Advantages
Being a pioneer in expanding aggregate production to new regions has its advantages. As one of the initial entrants, businesses have the unique opportunity to set industry standards, solidify their brand presence, and secure high-value contracts before competition heats up. Moreover, an early entry provides a chance to gain a deep understanding of the local market’s nuances. This knowledge can then be leveraged to tailor offerings, creating a compelling value proposition resonating with local needs.
Diversification of Risk
Concentrating operations in one region exposes businesses to potential risks such as local economic fluctuations, regulatory changes, or natural disasters. By diversifying the operational base across different regions, these risks can be spread out. This approach ensures that a downturn in one region doesn’t impact the entire business. Additionally, expanding aggregate production to new regions can serve as a hedge against seasonal demand fluctuations. For instance, if one region experiences a construction slowdown during specific months, operations in another region with contrasting seasonal dynamics can balance the dip.
Cons of Entering a New Region as an Aggregate Producer:
High Initial Investment and Setup Costs
Expanding aggregate production to new regions is not without its challenges, starting with the potential high costs. While there’s potential for increased revenue in a new region, there’s also a significant upfront investment required. This covers land acquisition, regulatory compliance, infrastructure setup, and machinery procurement. Beyond these tangible expenses, resources and time are needed to research the new market, forge local partnerships, and craft a brand presence. Given all these costs, the return on investment may take time, and there’s an inherent risk if the anticipated demand doesn’t pan out.
Regulatory and Compliance Challenges
A significant challenge of expanding aggregate production to new regions is navigating the unique regulatory norms and industry standards each region imposes. This regulatory landscape can be intricate, especially if the new region’s regulations are distinct from your current operations. Ensuring continuous compliance and staying updated with regulatory changes can be daunting. Misunderstandings or lapses in adhering to local regulations can lead to fines, potential legal actions, and a tarnished reputation.
Cultural and Operational Differences
When you consider expanding aggregate production to new regions, it’s crucial to understand the cultural and operational nuances of these areas. These differences go beyond mere business etiquettes. They encompass the local construction methodologies, material preferences, and even how contracts are negotiated. Misjudging these aspects can result in ineffective communication, products that don’t resonate with local needs, and lost business opportunities. Truly adapting and thriving requires time, patience, and genuine commitment to understanding and integrating with the local culture.
Increased Competition and Market Saturation
Moving into a new region means potentially going toe-to-toe with well-established players. These competitors have the home-ground advantage, complete with strong customer relationships, a grasp of local dynamics, and operational practices fine-tuned for that region. Carving out a space amongst such competition can be tough. There’s a real risk that in a bid to capture market share, prices might be driven down, affecting profit margins. Plus, if many producers have their sights set on the same region, market saturation becomes a genuine concern, which can water down returns for everyone involved.
Conclusion: Weighing the Pros and Cons of Expanding Aggregate Production to New Regions
Taking the step to expand aggregate production to new regions is a decision brimming with both potential rewards and intrinsic challenges. The allure of tapping into fresh markets, seizing growth opportunities, and achieving diversification is undeniably compelling. Nonetheless, obstacles such as substantial initial investments, intricate regulatory frameworks, cultural distinctions, and intense competition remain steadfast.
A fruitful foray into uncharted territories mandates thorough planning, profound comprehension of the local market, and a versatile approach to adapt swiftly. This is where Mineralocity Aggregates can position itself as your strategic partner. Equipped with extensive industry expertise and insights, our platform is meticulously crafted to offer aggregate producers the essential data and tools for making judicious decisions about their regional expansions. From demystifying the local regulatory environment to pinpointing potential market voids, Mineralocity Aggregates emboldens producers to traverse new landscapes with assiduity and precision.
Should you entertain the thought of venturing into a novel region, allow Mineralocity Aggregates to be the guiding compass on your expedition, ensuring every move is deliberate, enlightened, and tailored for enduring prosperity.
Unlock exclusive, groundbreaking market data with the 2022 Top Aggregate Producers Report. Don't miss out!
Gain a competitive edge with our 2022 Top Aggregate Producers Report! Get exclusive market share data on top producers in each U.S. state with market trends to strategize effectively. A must-have for every industry player!

25 Jul, 23
Understanding a Construction Aggregate Market Like a Local Player
Navigating the nuances of a local construction aggregate market can seem daunting, especially when you’re unfamiliar with the territory. Yet, the most successful businesses often operate with a localized touch, aligning their strategies to the very specific needs and trends of the communities they serve. To truly compete and thrive, understanding the market like a local player is essential. Here’s how you can get started:
1. Dive Deep Into Regional Consumption Patterns
Every locale has its unique patterns of construction aggregate consumption. Urban areas with ongoing infrastructure projects might have different demands than suburban or rural settings. Begin by analyzing per-capita consumption and compare it to broader national averages. Platforms like Mineralocity Aggregates provide insights tailored to specific regions, offering a leg-up in your research.
2. Forge Local Partnerships
Cultivating relationships with local businesses, government agencies, and other community stakeholders can be invaluable. They offer firsthand insights, often giving you a pulse on shifts in demand, regulatory changes, and upcoming large-scale projects. Moreover, partnerships can open doors for collaborative ventures and supply contracts.
3. Understand Local Regulations and Policies
Construction aggregate markets don’t operate in a vacuum. They’re heavily influenced by regional regulations, zoning laws, environmental guidelines, and taxation structures. Familiarize yourself with these rules, and if possible, engage local legal experts who specialize in construction and mining regulations.
4. Engage in Community Initiatives
Being an active participant in community events, fundraisers, or sustainability initiatives not only elevates your brand but also keeps you informed about local sentiments. Through these engagements, you can glean insights about residents’ attitudes towards construction projects, environmental concerns, and other relevant issues.
5. Monitor Competitor Activities
Local competitors often have a deep understanding of the market’s intricacies. Observing their strategies, pricing models, and marketing efforts can reveal key trends and gaps in the market. Moreover, by analyzing their strengths and weaknesses, you can tailor your approach to gain a competitive edge.
6. Invest in Local Talent
Hiring locally provides multiple advantages. Local employees often have ingrained knowledge of the community’s preferences, concerns, and challenges. They can guide decision-making, build trust with local stakeholders, and offer invaluable insights that might not be immediately apparent to outsiders.
7. Leverage Digital Platforms and Analytics
Using platforms like Mineralocity Aggregates ensures you have access to the latest data and market analysis. These platforms provide a comprehensive view of the market, highlighting shifts in demand, consumption patterns, and other pivotal metrics. The data-driven insights they offer can help align your strategies to the local market dynamics.
Conclusion
In the intricate landscape of construction aggregate markets, having a local player’s insight can significantly influence your success. It enables you to make informed decisions, foster community relationships, and respond proactively to shifts in demand and preferences. Embrace these strategies, and you’ll be well on your way to not just understanding but mastering the local market dynamics. Remember, platforms like Mineralocity Aggregates are your partner in this journey, equipping you with the tools and insights you need every step of the way.
Unlock exclusive, groundbreaking market data with the 2022 Top Aggregate Producers Report. Don't miss out!
Gain a competitive edge with our 2022 Top Aggregate Producers Report! Get exclusive market share data on top producers in each U.S. state with market trends to strategize effectively. A must-have for every industry player!