
Maps aren’t just about geographical locations; they can tell stories, reveal trends, and even predict the future. In the construction aggregate industry, understanding these layers of information can be the difference between growth and stagnation. In this article, we showcase five incredibly revealing maps from Mineralocity Aggregates that every industry player should examine.
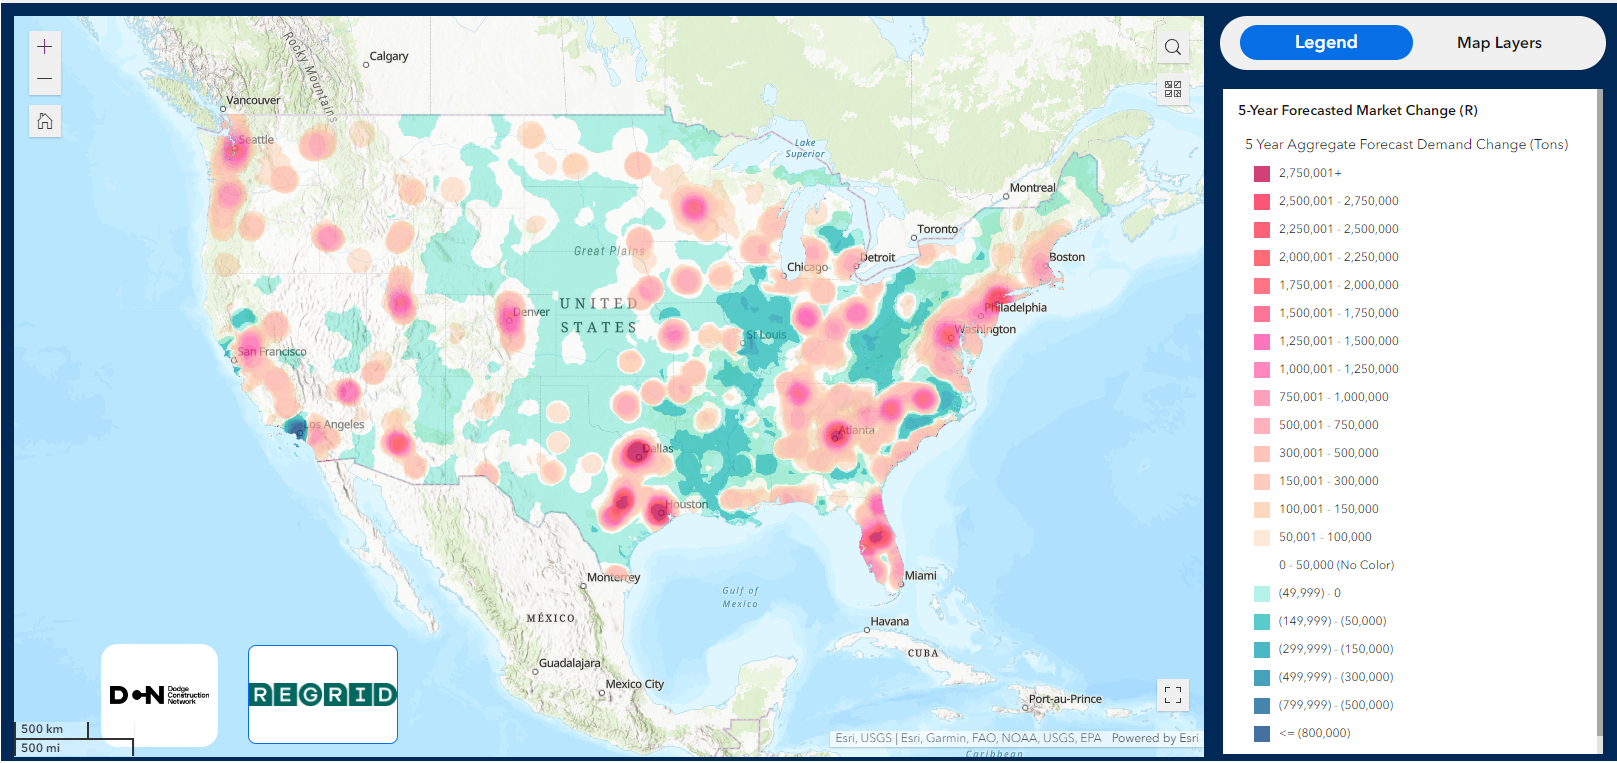
Brief Description: This map shows estimated market change for construction aggregates over the next five years.
Key Insights: East Texas, Atlanta, Tampa, Denver, Phoenix, Salt Lake, and other regions show major growth and significantly increased demand for construction aggregates. On the flip side, Los Angeles is showing a significant decrease in demand, as is most of Illinois and a significant part of the Appalachians.
Business Applications: Shifting demand creates opportunities to shift existing production to growing markets or consider greenfielding new sites near anticipated high demand. In areas of decreasing demand, operations may need to be scaled back or look to other markets or products to succeed.
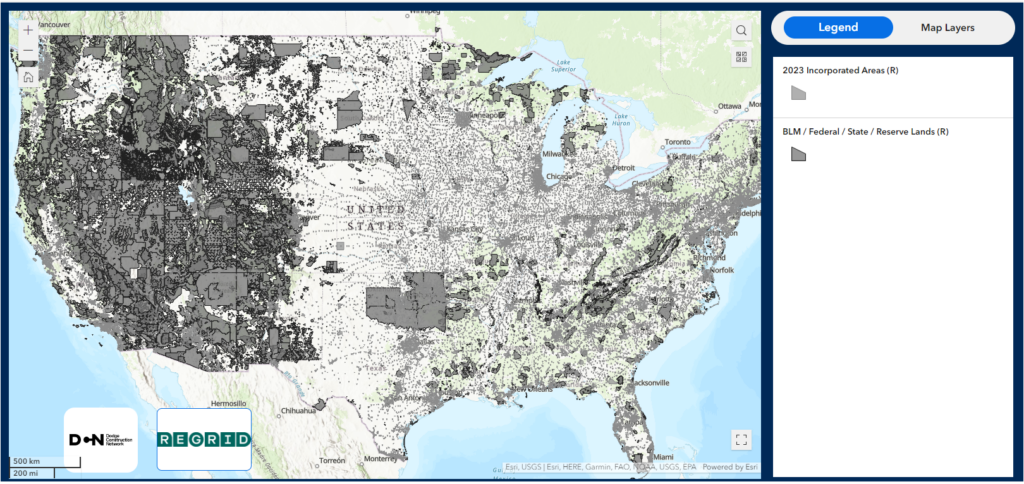
Brief Description: Every region of the United States has a different regulatory framework and fabric of land ownership. This map illustrates how much of the Western United States is covered by federal, state, and tribal lands. The light gray areas on the map illustrate incorporated areas, which are scattered throughout the country.
Key Insights: While not all gray areas are “off limits”, many will have significant challenges or regulatory hoops that will need to be navigated. Construction aggregate producing operations are found throughout many of these regions, but many may be located in areas that would be difficult, if not impossible, to permit today.
Business Applications: This map is useful for locating potential greenfield sites that are outside of incorporated areas or other places – like national parks or wilderness areas – that may be restrictive for development.
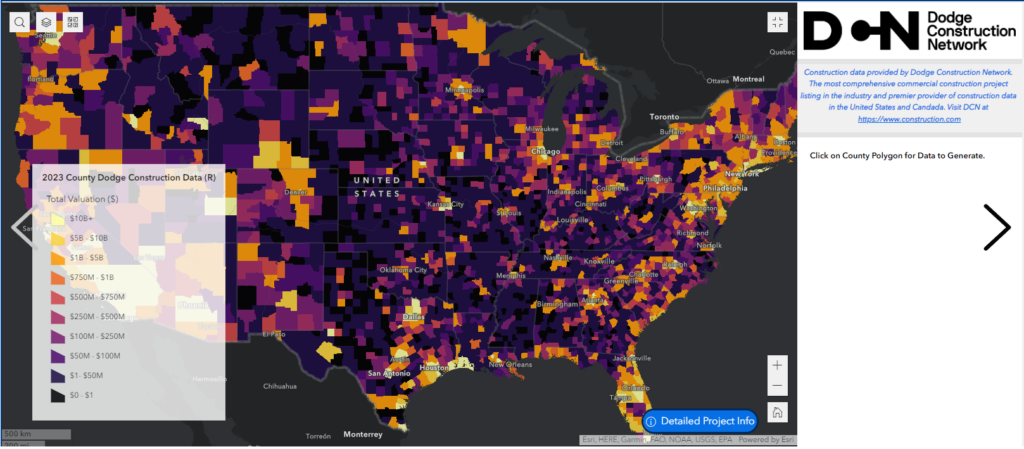
Brief Description: What does the map tell us about upcoming infrastructure and construction projects? The areas that are yellow represent the highest amount ($10 billion+) of construction aggregate heavy wide infrastructure, local infrastructure, and non-residential construction projects that are planned. The map is broken down by county. Within the Mineralocity Aggregates application, each of these counties can be explored further to identify the number of projects and anticipated spending for each category.
Key Insights: Much of this information correlates with the findings from our demand heatmap, but there are other areas where major aggregate heavy projects are occurring that don’t directly coincide with growing populations. Emery County, Utah – for example – has over $26.3 billion in planned projects and has only a small rural population.
Business Applications: Portable crushers and other quickly scalable operations can be considered for wide and local infrastructure projects that are in areas that don’t have a large permanent aggregate production base.
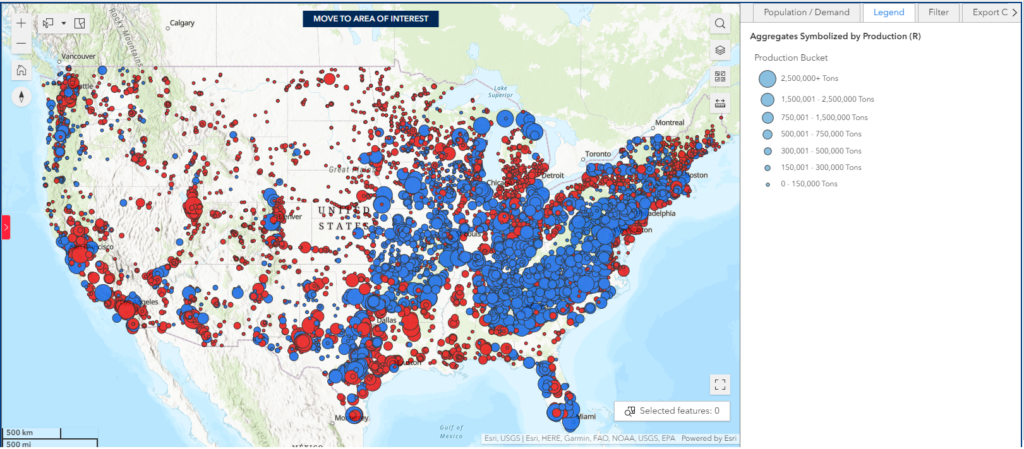
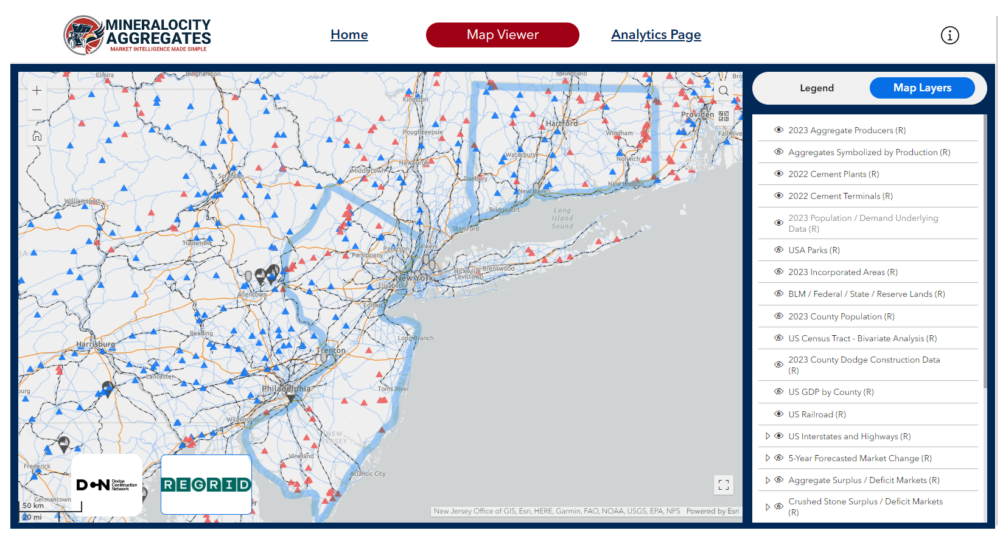
Brief Description: This map shows the relative side of construction aggregate producing operations throughout the United States. Blue circles are crushed stone producing operations (quarries) and red circles produce sand and gravel (pits or dredges).
Key Insights: The size of bubbles generally coincides with major population centers or rail access that ties to major urban centers. The distribution of blue and red circles is dictated by geology. You can see in the Southeastern United States, the curve of the fall line with rock above and coastal plane below with its associated sand and gravel operations. Bonus feature – Mineralocity Aggregates creates an interactive pie-chart that shows the actual market share for major producers within the map view. This is a powerful way to get a quick feel for major regional players when exploring new areas.
Business Applications: How could businesses use this information for their strategic planning? Understanding regional competition is key to discovering how to best strategically be positioned within a new market. Each region of the United States has a unique landscape of producers large and small.
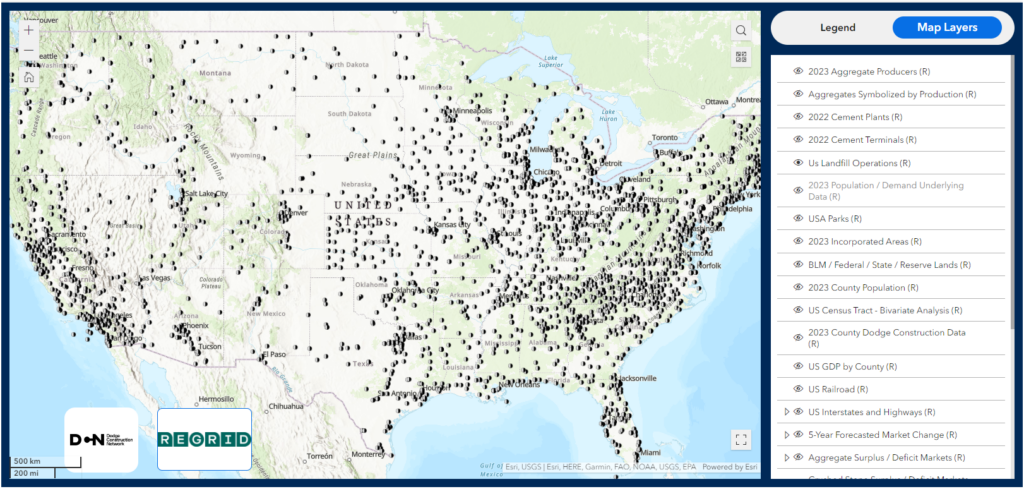
Brief Description: This map shows the location of every landfill location throughout the United States. This is where construction waste, ranging from excavation waste to concrete and asphalt goes to be buried and disposed of.
Key Insights: Recycled aggregate and construction waste is increasingly becoming a larger and more important aspect of the overall aggregate industry. While these recycled materials currently only account for a small percentage of overall consumed tonnage, it is likely that it will grow significantly over the next several decades. Early adapters will be positioned best to succeed.
Business Applications: Placing a recycling facility between major projects and landfills could create lucrative opportunities.
These maps offer a multi-dimensional view of the construction aggregate industry, providing actionable insights for businesses eager to carve out or defend their market share. By leveraging the power of Mineralocity Aggregates’ mapping capabilities, companies can make more informed decisions that lead to sustainable growth.
Ready to dive deeper? Sign up for Mineralocity Aggregates and start exploring these maps and many more for your strategic advantage.
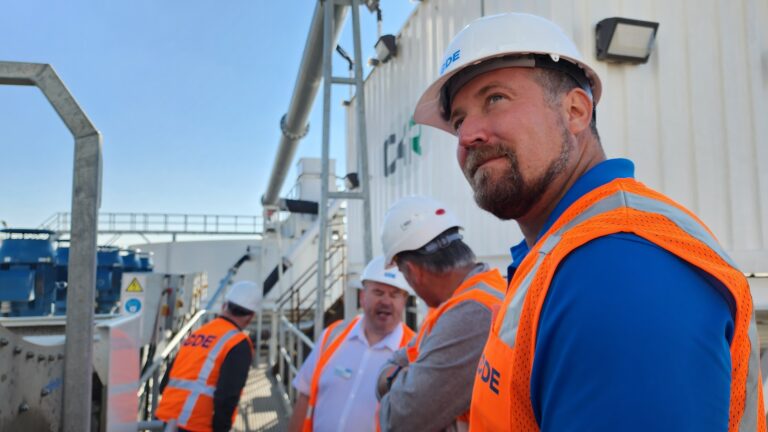
Last week, the Mineralocity Aggregates team had the distinct pleasure of touring Calgary Aggregate Recycling Inc., in Calgary, Alberta. The occasion was a special open house hosted by CDE, an Irish company at the forefront of traditional aggregate processing and cutting-edge recycling technology. This experience provided invaluable insights into the sustainable future of aggregate processing and recycling.
Before diving into the tour details, it’s important to understand the role that CDE plays in the aggregate recycling industry. With the motto, “Engineered for a Circular Economy,” CDE is doing more than just pioneering waste recycling; they’re laying the groundwork for a more sustainable future. They specialize in providing wet processing solutions that divert over 20 million tons of waste from landfills annually. Whether it’s construction and demolition waste, contaminated soils, or hydro excavation waste, CDE transforms these materials into valuable construction resources.
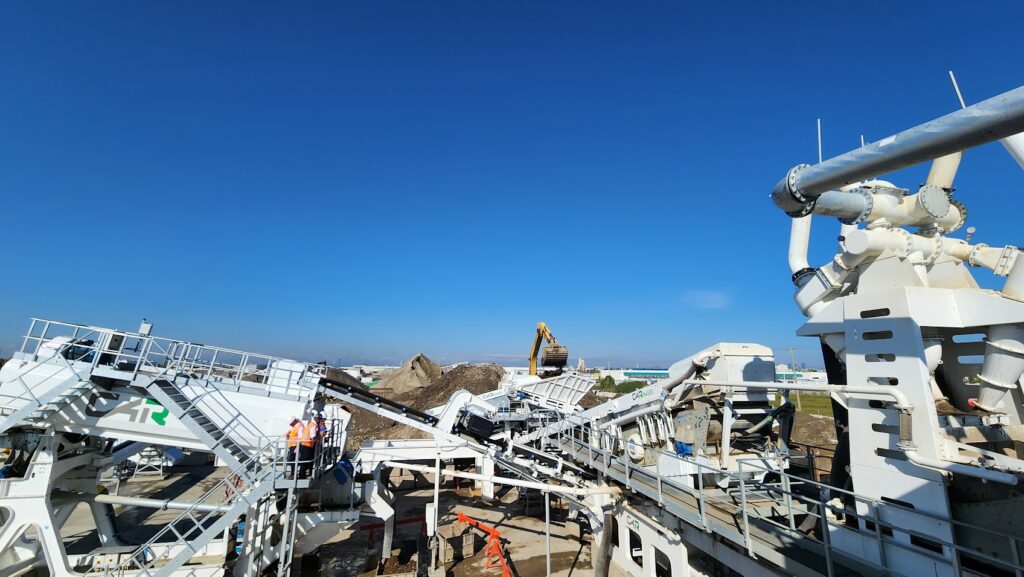
During our tour, we were fortunate enough to see the plant process different types of waste, including excavation and hydro excavation waste. The system, efficient and precise, separates the waste into sorted, washed, and screened streams of rock, sand, and fines.
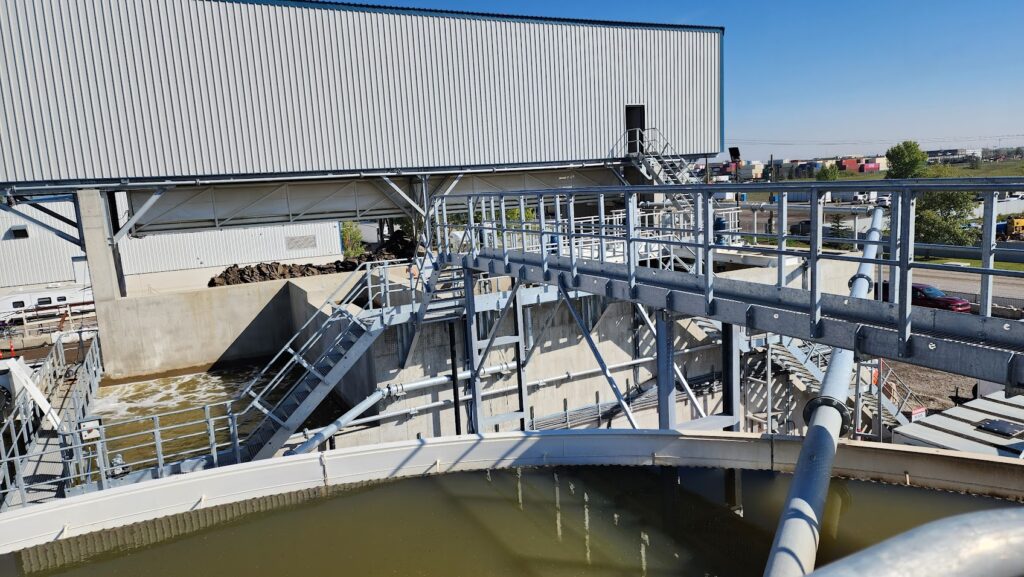
A highlight of the plant’s operation was its closed-loop water system, which recycles ~95% of the water used. This feature not only conserves a critical natural resource but also allows the plant to function with a minimal environmental footprint. This allows for faster permitting and a lower impact footprint.
What stood out during the tour was the plant’s commitment to efficiency. Every aspect of the operation can be monitored from a single dashboard, ensuring that each element runs at peak efficiency to maximize uptime. This is a crucial aspect for any plant that aims to be both profitable and sustainable.
The tour was more than just an educational experience; it was an inspiring vision of the potential that lies ahead. One of the most immediate takeaways was the need to reevaluate our perceptions of waste. Traditionally viewed as something to discard, waste, as demonstrated by Calgary Aggregate Recycling Inc. and CDE, can be a valuable resource.
The advanced technologies we observed have significant scalability and adaptability potential. With CDE’s wet processing solutions capable of diverting over 20 million tons of waste from landfills annually, one can only imagine the global impact if more such facilities were to adopt these technologies. And given that these technologies can be adapted to handle various types of waste—from excavation waste to contaminated soils—it opens doors for widespread industry adoption. We were told that CDE can build these plants to handle as little as 70tph to as much as 700tph. They also offer custom solutions that could potentially be even larger.
While the environmental implications are obvious, there are also substantial economic benefits to consider. The plant’s closed-loop water system, for example, significantly reduces water costs. The ability to monitor every aspect of the operation from a single dashboard allows for real-time decision-making, reducing downtime and boosting profitability.
The success of facilities like Calgary Aggregate Recycling Inc. should encourage policymakers to support sustainable practices in the aggregate industry. By doing so, they can facilitate the transition from traditional waste management to circular economic models that are both profitable and beneficial for the planet.
In a world that’s increasingly cognizant of environmental responsibility, adopting the practices showcased during our tour is more than just good business sense—it’s a societal imperative. Companies that are quick to embrace these technologies not only stand to gain a competitive edge but also become leaders in setting new industry standards.
By embedding these forward-thinking practices into our industry’s operations, we not only mitigate our environmental impact but also create a more resilient, cost-effective, and ultimately more sustainable business landscape. The tour reaffirmed our belief that with the right technologies and practices, the aggregate industry has a bright and sustainable future.
The tour of Calgary Aggregate Recycling Inc. was eye-opening, to say the least. It revealed a glimpse of what is possible when innovation meets sustainability. With companies like CDE leading the way, the future of aggregate recycling is not just promising; it’s imperative. And for teams like ours at Mineralocity Aggregates, it affirms our commitment to be part of this sustainable future.

In today’s fast-paced, technology-driven world, it’s easy to overlook traditional industries like construction aggregates. However, the reality is that the demand for aggregates—sand, gravel, crushed stone, and beyond—will never cease to grow. This article will explore the intrinsic factors that ensure the perpetual growth of the construction aggregates industry. While it’s true that the construction aggregates industry will always be growing somewhere, it won’t always be growing everywhere at the same time.
Aggregates are the backbone of nearly every construction project, from roads and bridges to schools and hospitals. As cities expand and populations grow, the need for new infrastructure and the repair of existing ones ensures that the demand for aggregates remains constant.
Furthermore, the current state of infrastructure in many parts of the country is alarming. Years of underinvestment have led to crumbling roads, outdated bridges, and inadequate public transportation systems. This decline is prompting large-scale infrastructure initiatives aimed at renovation and modernization, all of which require vast amounts of construction aggregates. The American Society of Civil Engineers regularly releases a ‘Report Card’ on the state of the nation’s infrastructure, and the grades are often less than stellar. These assessments only serve to highlight the urgent need for substantial investment in infrastructure projects, which, in turn, ensures a growing demand for aggregates for years to come.
The continued urbanization of the global population is a significant driver of aggregate demand. As rural populations move into cities, the requirements for housing, roads, and other infrastructure rise, thereby leading to a corresponding increase in the need for construction aggregates.
Even during economic recessions, certain public works projects are considered essential and continue to be funded. This makes the aggregate industry less susceptible to the fluctuations in the economic cycle compared to other sectors.
Modern technology isn’t sidelining the aggregates industry; it’s bolstering it. From data analytics platforms like Mineralocity Aggregates that optimize market analysis and positioning to advanced machinery that increases extraction efficiency, technology is fueling the growth of the sector.
While the industry faces environmental challenges, it is also part of the solution. Sustainable practices in aggregate extraction and the recycling of construction materials are not only possible but are becoming the industry standard.
With appropriate regulation, the aggregates industry can balance the needs of economic growth, environmental sustainability, and community concerns. This three-pronged approach ensures the industry’s long-term viability.
The construction aggregates industry is deeply woven into the fabric of modern society. Its importance in building the world around us—combined with the forces of urbanization, economic resilience, technological innovation, and environmental sustainability—makes it a sector poised for perpetual growth. Don’t underestimate the importance of this fundamental industry; it’s here to stay and grow, come what may.
Navigating the competitive landscape of the construction aggregate industry means being prepared for a multitude of challenges, from new competitors to economic shifts and beyond. Understanding these traditional threats to your market share is vital for long-term success. This article outlines some of these key factors and offers strategies to help you maintain and grow your market share.
The arrival of a new competitor in the construction aggregate industry can significantly impact your business, potentially eating into your market share. These newcomers often come armed with aggressive pricing strategies, innovative products, or even a unique marketing approach, designed to lure away even your most loyal customers.
The first step in effectively countering new competition is recognizing their presence as early as possible. This can be accomplished through consistent market research, watching for permitting applications, monitoring industry publications, and even keeping an ear to the ground among your customer base and suppliers.
Once you’ve identified a new player in the field, a detailed competitor analysis is essential. This will help you understand their strategies, strengths, weaknesses, and most importantly, their potential impact on your market share. Your SWOT (Strengths, Weaknesses, Opportunities, and Threats) analysis should be updated to include this new competitor. This will help you identify any adjustments needed in your own value proposition.
Based on your SWOT analysis, review your value proposition to identify how you can differentiate your offering from the new competitor. This might involve enhancing product features, revising pricing structures, or improving customer service. It’s crucial to remind your customers why they chose your brand in the first place.
The market conditions are ever-changing, especially with a new competitor stirring the waters. Continuously monitor their strategies, customer feedback, and their impact on your market share. This is a dynamic process that will likely require you to adapt your own strategies over time.
Platforms like Mineralocity Aggregates can provide data-driven insights into customer behavior, supply chain dynamics, and market trends. Utilize this data to adapt and refine your strategies for defending your market share against new competitors.
By understanding the strategies and tactics of new entrants, and responding proactively, you can mitigate the impact on your market share and even discover new opportunities for growth.
Local and regional economic conditions can dramatically affect your market share in the construction aggregate industry. Economic downturns often lead to reduced construction activities, while booms can bring about increased competition and higher operational costs. Here’s how to safeguard your market share during such uncertain times.
Be proactive in monitoring key economic indicators relevant to your industry. These might include interest rates, unemployment levels, and construction starts. Understanding these indicators can help you predict how market demand will be affected.
In times of economic instability, a rigid business model can be a liability. Flexibility allows you to quickly adapt to changing circumstances, whether it’s adjusting production levels, diversifying product offerings, or temporarily scaling back on certain operations.
Maintaining a healthy cash flow is crucial, especially during economic downturns. Consider renegotiating terms with suppliers or exploring alternative financing options to bolster your liquidity. This financial cushion can provide you with the room to maneuver when times get tough.
Cost optimization is not merely about cutting expenses; it’s about making your operation leaner and more efficient. This might include improving operational efficiencies or renegotiating contracts with suppliers. Any savings can be redirected to strategies aimed at maintaining or increasing market share.
Utilize risk management tools and strategies to prepare for potential financial downturns. This could include securing long-term contracts with favorable terms or hedging against market variables that could affect your costs, such as fuel prices.
Utilize data analytics platforms like Mineralocity Aggregates to gain insights into customer behavior, pricing elasticity, and market trends. This enables you to make informed decisions and develop adaptive strategies that can weather economic fluctuations.
By being prepared and adaptive, you can better defend your market share when economic conditions shift. Uncertain times often bring both challenges and opportunities—being agile and prepared can help you capitalize on the latter.
The construction aggregate industry often faces dramatic fluctuations in demand due to the cyclical nature of large construction projects. Whether it’s the commencement of a massive infrastructure project or the winding down of a long-term development, these shifts can significantly affect your market share. Here’s how to stay ahead:
Staying informed about local and regional construction activities is essential. Subscribe to industry journals, participate in local business forums, and maintain relationships with key players to gather early intelligence about upcoming projects or project completions.
When you anticipate an increase in demand due to an upcoming project, effective stockpile management becomes critical. You may need to ramp up production in advance to meet this demand, which will also necessitate calculating storage costs and considering the shelf-life of your aggregates.
When faced with a sudden influx of large projects, your operation must be scalable. This could mean leasing additional machinery, hiring temporary labor, or partnering with other producers. Scalability allows you to capitalize on increased demand without overextending your resources.
Large projects might require bulk quantities but at more competitive pricing. Revisiting your pricing strategy in such cases is crucial. Offering tiered pricing or early-bird discounts can not only secure a large project but also protect your market share.
As large projects wind down, demand for aggregates will drop, sometimes significantly. Having a transition plan can help you adjust your production levels and shift your focus to other markets or smaller projects. Failing to prepare for this drop in demand can result in overstock and reduced profitability.
Platforms like Mineralocity Aggregates can offer invaluable insights for predicting future demand patterns. Utilizing predictive analytics helps you prepare for market fluctuations, allowing you to make well-informed decisions regarding production, pricing, and distribution.
By staying proactive and adaptable, you can navigate the often unpredictable tides of project-based demand, defending and even growing your market share in the process.
In a constantly evolving landscape like the construction aggregate industry, defending your market share is a never-ending task. The threats are many and varied—from new competitors disrupting the market to economic uncertainties that can shake even the most stable of businesses. On top of that, the very nature of the industry is such that demand can ramp up or plummet based on the ebb and flow of large construction projects.
Adaptability and proactivity are your best allies in such an environment. Keeping an eye out for new entrants can help you maintain your competitive edge. During uncertain economic times, a well-honed financial strategy is your best defense, helping you to survive and even thrive. Similarly, understanding the dynamics of demand, particularly during the launch or conclusion of major projects, allows for smarter stockpile management, more dynamic pricing strategies, and a better-planned operational scale.
The thread that weaves all these strategies together is data. Advanced analytics platforms like Mineralocity Aggregates offer crucial insights that can shape your strategies and decisions. These platforms allow you to predict trends, understand market dynamics, and tailor your operations in a manner that not only defends your current market share but sets the stage for future growth.
In the end, the key to successfully defending and expanding your market share lies in your ability to be proactive rather than reactive. Strategies must be continuously reviewed, plans regularly updated, and your finger always kept on the pulse of industry shifts and changes.
If you’re eager to get even more insights into defending your market share, consider booking a free demo today to learn more about the Mineralocity Aggregates platform and how you can immediately leverage its powerful insights in your business!

In the competitive landscape of the construction aggregate industry, holding onto your market share is often as challenging as expanding it. The key to retaining your slice of the pie lies in proactive strategies that span across various domains, including pricing, customer retention, and innovation. In this guide, we’ll dive into each of these critical pillars and how they can be effectively managed for defending market share in the aggregate industry.
Setting the right price for your aggregates is not just a matter of arithmetic; it’s a strategy that can make or break your market share. Pricing influences not only immediate sales but also impacts long-term customer relationships. Here’s how to wield pricing as a powerful tool for defending market share in the aggregate industry:
Understanding Your Costs
Before you even think about setting a price, it’s crucial to have a clear understanding of your production and operational costs. This includes everything from raw materials to labor, transportation, and overhead. Knowing your costs sets the floor for your pricing strategy and helps avoid selling at a loss, a cornerstone principle in defending market share in the aggregate industry.
Value-Based Pricing
Gone are the days when the lowest price won the customer. Today’s buyers are increasingly looking for value, which encompasses not just the product but also the entire customer experience. Can you provide faster delivery times? Is your customer service exceptional? Are your aggregates of higher quality compared to competitors? All of these factors can justify a slightly higher price if customers perceive they are getting better value.
Dynamic Pricing Strategies: A Real-World Example
In the volatile market of construction aggregates, static pricing can be a severe disadvantage. Consider implementing dynamic pricing, where prices are adjusted based on real-time market conditions such as fluctuations in demand, seasonal trends, or competitor pricing. For instance, a mine recently required customers to purchase one ton of concrete sand (of which they had an excess) in order to purchase a ton of gravel (which was more scarce and valuable in the area). This not only enabled the mine to move inventory efficiently but also provided customers with a bundled solution, meeting multiple needs in one transaction. Such innovative strategies can be automated using advanced data analytics platforms like Mineralocity Aggregates, which closely monitor market conditions and offer valuable insights for defending market share in the aggregate industry.
Discounting and Bundle Pricing: A Tactical Edge for Defending Market Share
Strategic discounting and bundle pricing are effective ways to increase sales volumes, thereby defending or even growing your market share. For example, offering a discount for bulk orders or longer-term contracts can incentivize customers to make larger, more committed purchases.
Communication and Transparency in Pricing
Any pricing strategy is only as effective as its communication. Make sure your customers understand your pricing model, what they’re paying for, and why it offers better value. Transparency can go a long way in building trust, an essential factor in defending market share in the aggregate industry. By meticulously crafting your pricing strategies, you’re not just setting a price; you’re defining the value of your brand and product in the eyes of the customer.
Keeping an existing customer is generally cheaper and more efficient than acquiring a new one. The aggregate industry is no different. Focus on customer service, transparent communication, and reliable delivery to keep your customers coming back. Additionally, customer loyalty programs or long-term contracts can be an excellent way to secure steady business while also locking in a portion of your market share.
The saying “innovate or die” holds particularly true in the construction aggregate industry. Innovation isn’t confined to the product alone; it extends to processes, supply chain management, and even customer interaction channels. Embrace technology solutions like the Mineralocity Aggregates platform to gather data-driven insights, predict future demand, and streamline operations.
Platforms like Mineralocity Aggregates not only assist in predicting future trends but also offer the ability to visually compare current and future supply and demand balances side by side. In an industry where the margins can be thin, these data-backed insights can be game-changing when it comes to defending market share in the aggregate industry.
Defending your market share requires a multifaceted approach that spans pricing, customer retention, and innovation. While each of these pillars is essential, their true power lies in their integration. Utilizing platforms like Mineralocity Aggregates can offer invaluable insights and data, ensuring that your strategies are not just reactive but proactively aligned with market dynamics.
Intrigued by the strategies discussed in this article? To learn more, download our Top Aggregate Producers Report for 2023 and get ahead in your market share defense game.

In the ever-evolving landscape of the construction aggregate industry, one constant remains: the need to predict supply and demand accurately. Businesses that can forecast effectively find themselves better positioned in their markets and more prepared for future challenges. In this article, we delve into the rudiments of supply and demand in construction aggregates and how you can forecast future needs. We also introduce a groundbreaking tool, Mineralocity Aggregates, that can transform the way you look at market data.
The principles of supply and demand are universal, and in the aggregate industry, these factors can be influenced by a myriad of variables. However, a fundamental way to gauge market demand is by looking at the population within a defined radius of your operation—generally, 40 to 60 miles—and multiplying it by the regional per-capita annual construction aggregate consumption number. According to the National Stone, Sand & Gravel Association (NSSGA), the average stands at about 7-10 tons per capita. This number can vary significantly from year to year, so it is important to use a long term average.
To establish the supply and demand balance, you take the estimated supply in a specific region and subtract the demand. The resulting number will indicate whether you are dealing with a surplus or a deficit.
Estimating future demand is not a shot in the dark but a calculated extrapolation based on available data. One crucial element is population growth. By utilizing figures from sources such as the U.S. Census Bureau, it’s possible to estimate demand for the next 5, 10, 15, or even 20 years.
What if we told you that there’s a tool that has already calculated future demand for the entire United States, enabling you to compare current and future supply and demand side by side? Enter Mineralocity Aggregates.
With this platform, you can go a step further and quantify the value of future demand in each U.S. county. Leveraging proprietary data provided by Dodge Construction Network, we give you insights into planned but not yet started infrastructure projects that are likely to be aggregate-intensive.
Predicting and understanding market trends is crucial for the longevity of your business. Whether it’s monitoring the pulse of local demographics or keeping an eye on regional infrastructure projects, having the right data and tools at your disposal is a game-changer. Mineralocity Aggregates not only delivers this but also offers a user-friendly interface that makes the entire process efficient and effective.
Understanding the basic dynamics of supply and demand, combined with strategic forecasting, can make all the difference in positioning your aggregate business for long-term success. Mineralocity Aggregates simplifies this complex task, putting comprehensive data and predictive analytics at your fingertips.
Ready to get ahead of the curve? Request a free demonstration today to explore the depth and breadth of our platform’s capabilities.
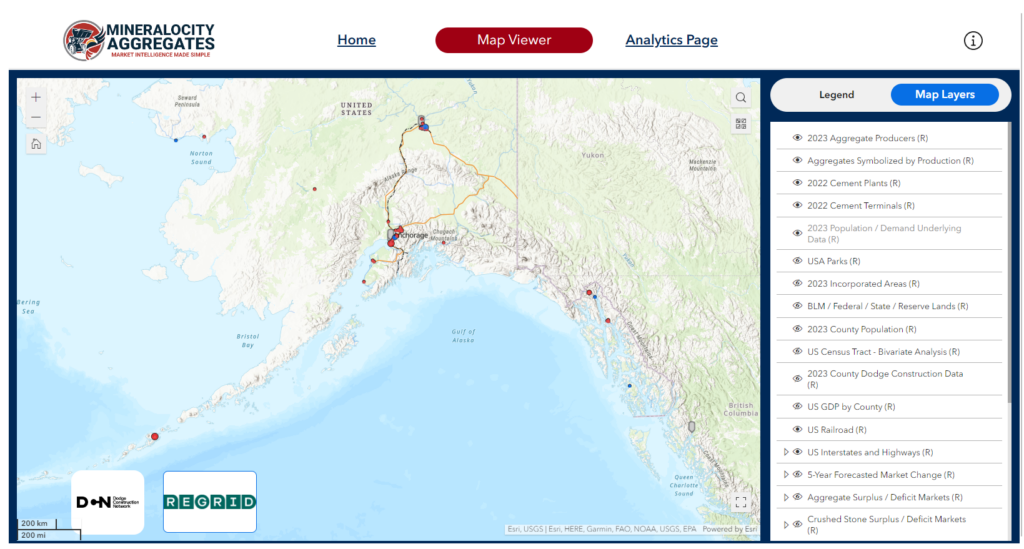
In a competitive landscape featuring global giants with vast resources, it may seem like an uphill battle for local aggregate producers to carve out a market share. However, states like Alaska show a unique market dynamic, where a diverse range of producers competes effectively. How do local companies stand their ground against these Goliaths? This article aims to uncover the secret sauce that allows smaller local firms to be a David in a world full of Goliaths.
While aggregate markets in many regions tend to be dominated by a few large players, Alaska presents a unique case where no single company holds a monopoly. The competitive landscape is diversified, which is indicative of the region’s unique challenges and opportunities. Let’s look at the top three aggregate producers in Alaska:
Colas SA: 7% Market Share
Colas SA is a global powerhouse hailing from France, with diversified interests ranging from civil engineering to road building, railroads, and, of course, construction aggregates. The company’s broad expertise and international reach allow it to bring cutting-edge technologies and practices to Alaska’s aggregate market. Operating in a locale that has its own unique set of challenges—ranging from extreme weather conditions to logistics—Colas SA has proven its capability to adapt and innovate.
Anchorage Sand & Gravel Company Inc: 6% Market Share
With over 85 years of operational history, Anchorage Sand & Gravel Company Inc is deeply rooted in Alaska’s construction landscape. Based in Anchorage, most of their aggregate supplies come from the Palmer region and are transported via rail to their base. The company’s long history and local expertise make it a go-to choice for many Alaskan construction projects, both big and small. The company is likely to be one of the oldest aggregate producers in the state. Their local sourcing strategy also helps in reducing the carbon footprint and supports regional economic development.
Brice Incorporated: 6% Market Share
Brice Incorporated is another key player that adds to Alaska’s diverse aggregate market. Unlike Colas SA, Brice is a home-grown Alaskan business. Operating under the umbrella of Brice Companies, they offer a wide range of services from civil construction to marine services, equipment rentals, and quarry materials. Brice Incorporated stands out for its capability to complete projects in Alaska’s most remote locations, often under challenging conditions. The company’s reputation for delivering quality work on time and within budget has made it a preferred choice for many in the state.
Local producers can compete heavily with major national producers in Alaska, let’s explore why:
In Alaska, the dispersion of population centers is not just a logistical hurdle; it’s a defining aspect of the local aggregate industry. The state’s sprawling landmass, punctuated by mountain ranges, rivers, and large swathes of unoccupied territories, makes it exceedingly challenging for any single entity to monopolize distribution. Unlike in the contiguous states, where major highways and extensive rail networks facilitate the rapid movement of materials, Alaska’s infrastructure is limited, often requiring a combination of road, rail, and even sea or air transport to reach remote areas.
Many of Alaska’s population centers are not only widely spaced but also highly isolated, sometimes accessible only by boat or plane. Such locations include small coastal communities, indigenous villages, and work camps for oil, gas, and mining operations. This isolation transforms logistics from a routine business consideration into a critical factor for the aggregate market. It’s not merely about getting the aggregate materials from Point A to Point B; it’s about overcoming a gauntlet of geographic, climatic, and infrastructural challenges that can fluctuate seasonally, or even daily.
As a result, the ability of local aggregate producers to adapt quickly and offer more tailored services becomes a significant competitive advantage. They can often provide materials with shorter lead times and more customized delivery plans than larger corporations, which may not be as attuned to Alaska’s unique challenges. In essence, the state’s geography serves as an equalizer, fostering a more diverse landscape of aggregate producers and offering opportunities for local businesses to carve out their own specialized niches.
Another advantage local companies have is lower overhead costs. These companies can be nimble, allowing them to pop up where smaller-scale production meets market demands, which can be cost-prohibitive for major players.
Focus on Niche Markets
As seen in states like Idaho and Nevada where the top producers only have a market share of around 9%, local companies can compete by specializing in niche markets or products that bigger companies might overlook. Many small, yet growing markets may have not yet reached a level where the major players consider it worth investment.
Leverage Local Relationships
Companies like Anchorage Sand & Gravel and Brice Incorporated in Alaska use their local relationships to secure long-term contracts that may not be as accessible to global firms who aren’t as familiar with local community needs and business culture.
Agility and Quick Decision-making
Local producers can often make quicker decisions without going through layers of corporate bureaucracy. This agility allows them to adapt rapidly to market changes, be it fluctuating demand or disruptions in supply chains.
While Alaska offers a compelling example of a market where no single aggregate producer holds a monopoly, it is far from being an outlier. Several other states, including Arizona and Colorado, similarly demonstrate diverse market shares among top producers. This diversity provides a conducive environment for both local and national businesses to operate and grow. Below, we delve into the unique market landscapes in Arizona and Colorado.
Arizona: A Blend of National and Local Powerhouses
In Arizona, the aggregate market is characterized by a blend of both national and local producers. Companies like Vulcan Materials and Cemex share the space with Arizona-based businesses such as Superstition Crushing. The state’s growing urban centers, like Phoenix and Tucson, provide a robust demand for aggregates, making it a lucrative market for various players. Additionally, the state’s focus on sustainable sourcing practices offers opportunities for businesses to incorporate eco-friendly operations.
Colorado: Geographical Diversity Spurs Market Fragmentation
Colorado’s aggregate market is fragmented, much like its varied geography. With regions ranging from the Rocky Mountains to the Eastern Plains, the state has a diversified set of aggregate needs. This diversity allows companies specializing in different types of aggregates to co-exist and thrive. Companies like Martin Marietta and LafargeHolcim find themselves competing with local producers like Whitewater Building Materials Corp. Moreover, the state’s investment in infrastructure projects provides a constant demand, creating room for new entrants.
Opportunities for Local Businesses
The case studies of Arizona and Colorado underscore that opportunities abound for local businesses to gain a foothold in the market. These states, much like Alaska, demonstrate that market diversity and competitiveness can be the norm rather than the exception. Entrepreneurs and small to mid-size businesses can take inspiration from these markets to develop strategies tailored to local conditions, whether it be through specializing in a specific type of aggregate or through adopting sustainable practices that resonate with local demand.
While the competition is fierce, and the opponents are massive, the story of David vs Goliath is alive and well in the aggregate industry across the United States. From Alaska to Arizona, local firms can employ a range of strategies to compete effectively against global heavyweights. In an industry that often seems dominated by giants, there’s still room for the smaller players to not only survive but thrive.
Interested in diving deeper into this topic? Check out Mineralocity Aggregates, a cutting-edge platform offering comprehensive market intelligence, including insightful data on how local and global companies are competing in every state. Check out our Top Aggregate Producers Report to learn more about the top producers in each US state.
Gain a competitive edge with our 2022 Top Aggregate Producers Report! Get exclusive market share data on top producers in each U.S. state with market trends to strategize effectively. A must-have for every industry player!
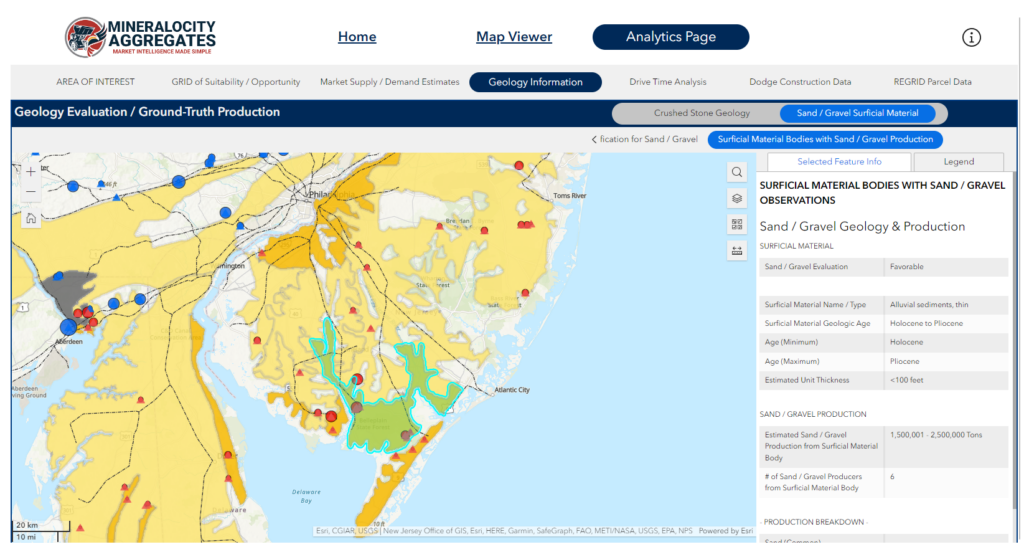
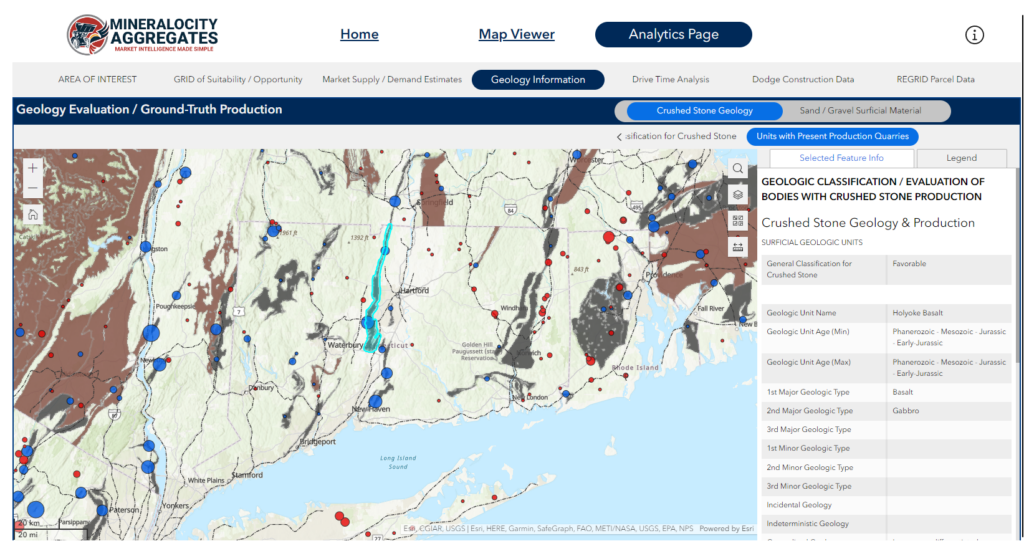
When it comes to aggregate production, bigger isn’t always better. While states like Texas and California garner much attention due to their large geographical size and abundant resources, smaller states like Connecticut and New Jersey consistently show impressive aggregate production figures. But how is it possible for these smaller states to compete with the bigger players? The answer lies in a combination of factors, including efficiency, quality, and strategic location.
Connecticut, for example, is a small state with a total aggregate production of 14,991,416. What makes this number truly noteworthy is the market share of the top producers, with CRH PLC holding 43%, O & G Industries Inc at 8%, and Rawson Materials Inc. at 7%. Despite having limited land area and resources, these companies have honed their operations to an art, squeezing every bit of value out of the materials they produce.
In both Connecticut and New Jersey, the quality of aggregates is another key factor that allows these states to punch above their weight. Superior geological formations offer high-quality materials that often fetch higher market prices, making these states competitive in a crowded market. New Jersey has an abundance of quality sand and gravel resources, while Connecticut has quality crushed stone available throughout narrow geological bands throughout the state. Both are illustrated within the Mineralocity Aggregates platform and shown in the screenshots below:
When discussing the aggregate production success of states like Connecticut and New Jersey, it’s important to understand their economic ties with neighboring regions. This interconnectedness not only adds another layer to their capability to produce and export aggregates but also makes them key players in the broader economic landscape.
Both New Jersey and Connecticut are deeply connected to New York, particularly New York City, the economic hub of the region. With a large commuting population traveling for work between these states and the city, there’s a constant flow of economic activity. Companies such as MetLife, Prudential Financial, and Johnson & Johnson are Fortune 500 entities headquartered in New York City, but they also have significant operations and workforce in New Jersey and Connecticut. Moreover, New Jersey serves as a major transportation hub for New York, and the Port of Newark is among the busiest ports in the United States. This facilitates the smooth transfer of aggregate materials to various markets.
Pennsylvania is another vital partner that shares long borders with New Jersey and Connecticut. As major suppliers of goods and services, including aggregates, to Pennsylvania-based businesses, these states experience a beneficial economic interchange. The shared borders also mean that Pennsylvania is a notable tourist destination for people residing in both New Jersey and Connecticut, which indirectly boosts the aggregate demand for infrastructure projects. It should be noted that Pennsylvania is also a major aggregate producer for its size with an annual estimated 2022 production of over 105 million tons.
Though smaller in size, Massachusetts commands significant economic importance. It is home to corporations that are giants in sectors such as life sciences, technology, and finance, like Boston Scientific and Fidelity Investments. Collaborative efforts between Massachusetts and New Jersey or Connecticut businesses are frequent, particularly in these specialized sectors. This kind of cross-border investment and collaboration extends to the aggregate industry, where the high-quality aggregates from Connecticut and New Jersey find lucrative markets.
Rhode Island may be the smallest New England state, but it has a significant economic footprint, hosting Fortune 500 companies like CVS Health and The Providence Journal. The sectors of manufacturing, tourism, and healthcare see particularly strong collaborations between Rhode Island and New Jersey or Connecticut businesses, creating an avenue for aggregate material exchange and investment.
While the closest and most robust economic relationships are with neighboring New England states, New Jersey and Connecticut are not limited to these borders. Their reach extends nationally and even globally, but it’s this local interconnectedness that significantly fuels their impressive aggregate production figures.
Both states have adopted sustainable aggregate production methods, such as recycling old concrete into new aggregate, that not only reduce the environmental impact but also contribute to efficiency.
The tale of Connecticut and New Jersey serves as a lesson that size doesn’t always matter. It’s a mix of efficiency, quality, and location that makes these states stand out. If you’re intrigued by these insights and want to know who else is making waves in the aggregate industry, don’t miss our Top Aggregate Producers Report for 2023. Discover how companies like Mineralocity Aggregates are shaping the future of aggregate production.
Gain a competitive edge with our 2022 Top Aggregate Producers Report! Get exclusive market share data on top producers in each U.S. state with market trends to strategize effectively. A must-have for every industry player!
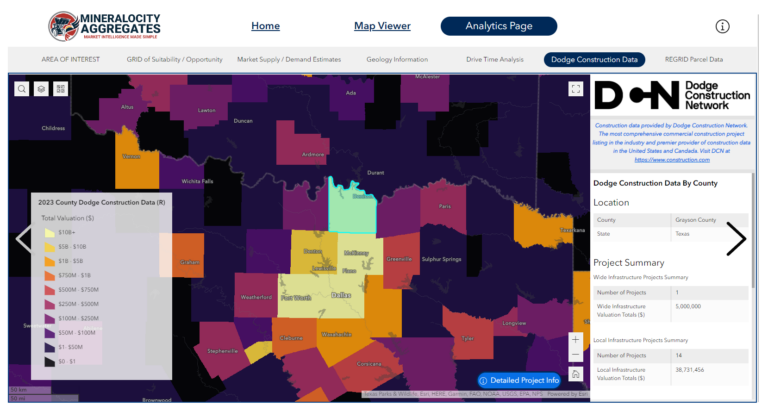
When it comes to the construction aggregate industry, knowing where to focus your attention and resources can be half the battle. Thanks to exclusive data from Dodge Construction Network, and rigorous analysis on the Mineralocity Aggregates platform, we’re spotlighting four U.S. counties where future demand for construction aggregates is poised to skyrocket.
Total Projects: 92
Total Valuation: $30 Billion
Grayson County is a hidden gem, with a total valuation of $30 billion in potential projects, setting the stage for immense construction aggregate demand in the near future.
Total Projects: 991
Total Valuation: $20.37 Billion
San Bernardino is a hive of construction activity with almost a thousand projects valued at over $20 billion. It’s a potential goldmine for construction aggregate suppliers.
Total Projects: 2,319
Total Valuation: $106.64 Billion
In Maricopa, the numbers are staggering. With a colossal valuation exceeding $106 billion, this county is on the cusp of unprecedented growth in construction aggregate demand.
Total Projects: 710
Total Valuation: $77 Billion
Cook County’s diversity in project types and a valuation of $77 billion make it a hotbed for construction aggregate demand, ranging from infrastructural to non-residential projects.
Construction data provided by Dodge Construction Network. The most comprehensive commercial construction project listing in the industry and premier provider of construction data in the United States and Canada. Visit DCN at https://www.construction.com
This invaluable data has been exclusively analyzed on the Mineralocity Aggregates platform and mapped out for every U.S. county to forecast future construction aggregate-intensive projects—projects that haven’t yet started but have a high likelihood of occurring.
These are just a few examples. Imagine the opportunities waiting to be discovered nationwide! With a subscription to Mineralocity Aggregates, you gain access to an incredibly powerful tool designed to identify potential areas of growth and future construction aggregate demand. What are you waiting for? Dive into a world of opportunity. Book your live demo now. Don’t miss your chance to be ahead of the curve.
Gain a competitive edge with our 2022 Top Aggregate Producers Report! Get exclusive market share data on top producers in each U.S. state with market trends to strategize effectively. A must-have for every industry player!
The construction aggregate industry is the unsung hero of the building world, playing a vital role in the production of everything from roads to skyscrapers. Despite its foundational importance, the industry is often misunderstood or overlooked by those outside it. One of the most intriguing aspects of the construction aggregate industry is the way market share and state production interact. While state production figures provide us with an idea of the total output of aggregates, the market share helps to understand how concentrated or fragmented the market is. Understanding the relationship between these two factors is crucial for both seasoned experts and industry novices. It can reveal growth opportunities and present a clearer picture of the industry landscape. Utilizing exclusive data from Mineralocity Aggregates and backed by thousands of hours of market research and analysis, this article will explore some of the dynamic between market share of the top state producers and total state production / state size to see if a correlation can be established.
Before delving into the topic, let’s take a brief look at some key data points:
This is just a snapshot, but it begins to tell a compelling story.
High Production, Low Market Share
States like California have high production but surprisingly low market share for top producers. This suggests a more fragmented market where multiple players compete. Such landscapes often offer room for newer entrants and innovative solutions.
Low Production, High Market Share
In contrast, states like Connecticut, with 14,991,416 in total state production and a staggering 58% market share for the top producers, indicate a concentrated market. Here, new entrants will find it challenging to carve a niche. The high market share also often points to mature markets where the top players have significant leverage.
Balanced Production and Market Share
States like Alabama present a balanced picture, with a total state production of 60,075,895 and top producers controlling 54% of the market. This balance suggests that while there are dominant players, there’s still room for competition and growth.
Regional Dynamics and State Policies
The correlation is also influenced by regional dynamics and state policies. For example, the lower market share in states with high production could be a result of favorable policies that encourage competition. On the other hand, high market share in states with low production could signal strict regulations that create barriers to entry.
Understanding this correlation can provide invaluable insights for business decisions:
While aggregate production is undeniably influenced by factors like market demand, availability of raw materials, and economic conditions, the role of geographic size has not likely been explored previously. Given the logistical requirements associated with the mining and transport of construction aggregates, the size of a state could be a noteworthy factor that correlates with market share distribution among top producers.
To explore this correlation, we juxtapose data on total state production and top producer market share against the geographic size of the state. States with larger land areas may experience higher costs associated with transportation, potentially affecting the distribution of market share. Conversely, smaller states may have a more even spread among top producers due to shorter transit distances and thus, lower logistical costs.
The correlation between total state size and top three producer market share appears to be stronger than the correlation between market share and total state aggregate production. This could be attributed to a number of factors, including transportation logistics and market reach of individual operations.
Logistical Costs: In larger states, the logistical costs associated with transporting aggregates seem to dilute the market share of top producers and reduce the reach of each operation, requiring smaller (often independent) operations to fill the gaps.
Regional Monopolies: In larger states, it’s more likely for regional monopolies of multiple operations to exist rather than a single dominant player across the state.
High Concentration in Smaller States: The top producers in smaller states tend to have higher market shares, potentially due to lower logistical constraints and less area to cover with a single operation.
Strategic Planning: Understanding this correlation can help companies plan better for scale, market entry, or operational efficiency based on the state’s geographic size.
While the data points to an interesting and potentially stronger correlation between state size and market share, it’s essential to recognize that other variables such as demand, state policies, and economic conditions are also in play. However, the role of geographic size in shaping market share dynamics offers a unique lens for industry analysis, which could be particularly valuable for strategic planning.
Want to take a deeper dive into the data? Get your hands on the report that industry veterans are calling a “must-read for any serious player in the aggregate market.” Download the Mineralocity Aggregates 2022 Top Aggregate Producers Report now, and step into the future of construction aggregate business with confidence.
Gain a competitive edge with our 2022 Top Aggregate Producers Report! Get exclusive market share data on top producers in each U.S. state with market trends to strategize effectively. A must-have for every industry player!