Maps aren’t just about geographical locations; they can tell stories, reveal trends, and even predict the future. In the construction aggregate industry, understanding these layers of information can be the difference between growth and stagnation. In this article, we showcase five incredibly revealing maps from Mineralocity Aggregates that every industry player should examine.
1. The Demand Heatmap: A Glimpse into Future Needs
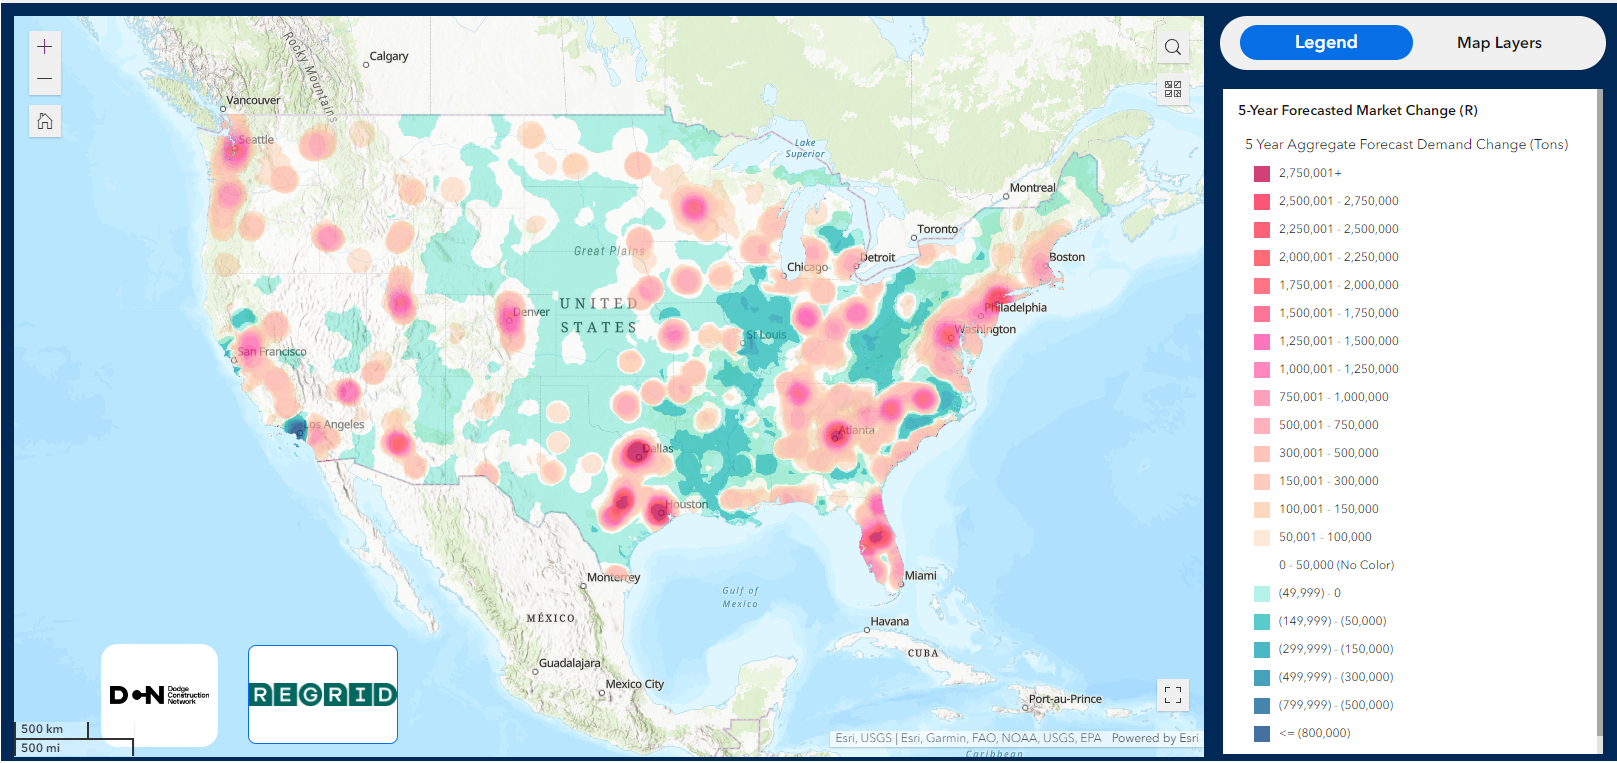
This map shows estimated demand change for construction aggregates in the United States. This map is interactive on the Mineralocity Aggregates platform.
Brief Description: This map shows estimated market change for construction aggregates over the next five years.
Key Insights: East Texas, Atlanta, Tampa, Denver, Phoenix, Salt Lake, and other regions show major growth and significantly increased demand for construction aggregates. On the flip side, Los Angeles is showing a significant decrease in demand, as is most of Illinois and a significant part of the Appalachians.
Business Applications: Shifting demand creates opportunities to shift existing production to growing markets or consider greenfielding new sites near anticipated high demand. In areas of decreasing demand, operations may need to be scaled back or look to other markets or products to succeed.
2. Environmental Regulations and Zoning: Navigating the Minefield
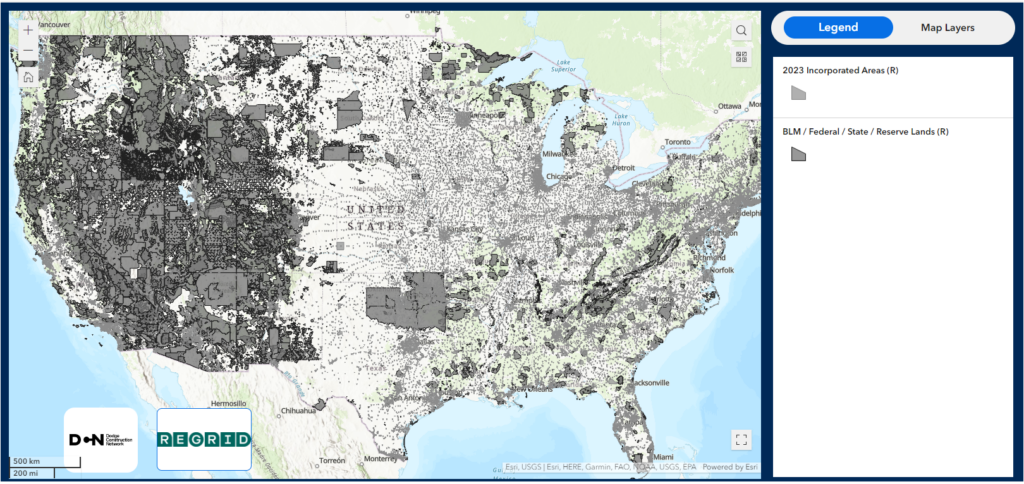
This map shows incorporated, state, federal, tribal, and other lands. This map is interactive on the Mineralocity Aggregates platform.
Brief Description: Every region of the United States has a different regulatory framework and fabric of land ownership. This map illustrates how much of the Western United States is covered by federal, state, and tribal lands. The light gray areas on the map illustrate incorporated areas, which are scattered throughout the country.
Key Insights: While not all gray areas are “off limits”, many will have significant challenges or regulatory hoops that will need to be navigated. Construction aggregate producing operations are found throughout many of these regions, but many may be located in areas that would be difficult, if not impossible, to permit today.
Business Applications: This map is useful for locating potential greenfield sites that are outside of incorporated areas or other places – like national parks or wilderness areas – that may be restrictive for development.
3. Infrastructure Development Tracker: The Pulse of Construction
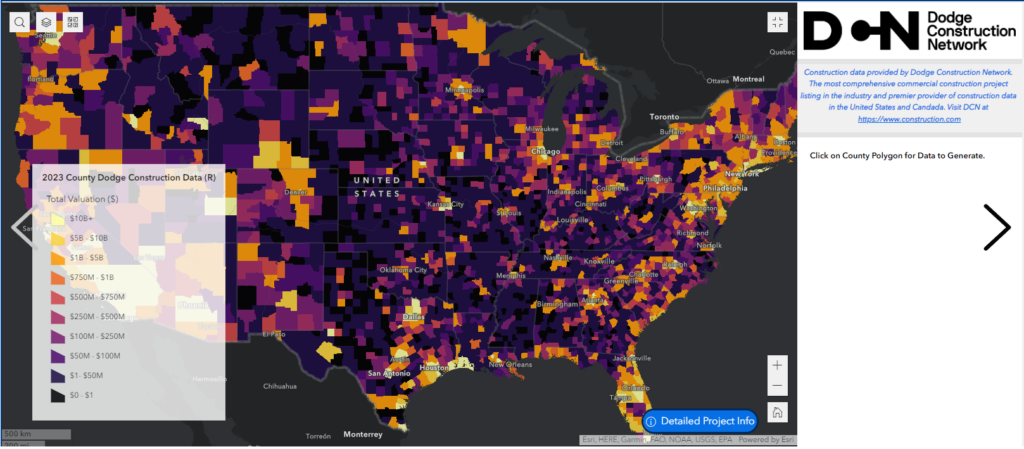
A map showing aggregate intensive planned construction projects in the United States by county. These include wide infrastructure, local infrastructure, and non-residential construction. This map is interactive on the Mineralocity Aggregates platform.
Brief Description: What does the map tell us about upcoming infrastructure and construction projects? The areas that are yellow represent the highest amount ($10 billion+) of construction aggregate heavy wide infrastructure, local infrastructure, and non-residential construction projects that are planned. The map is broken down by county. Within the Mineralocity Aggregates application, each of these counties can be explored further to identify the number of projects and anticipated spending for each category.
Key Insights: Much of this information correlates with the findings from our demand heatmap, but there are other areas where major aggregate heavy projects are occurring that don’t directly coincide with growing populations. Emery County, Utah – for example – has over $26.3 billion in planned projects and has only a small rural population.
Business Applications: Portable crushers and other quickly scalable operations can be considered for wide and local infrastructure projects that are in areas that don’t have a large permanent aggregate production base.
4. Competitor Landscape: Know Thy Neighbor
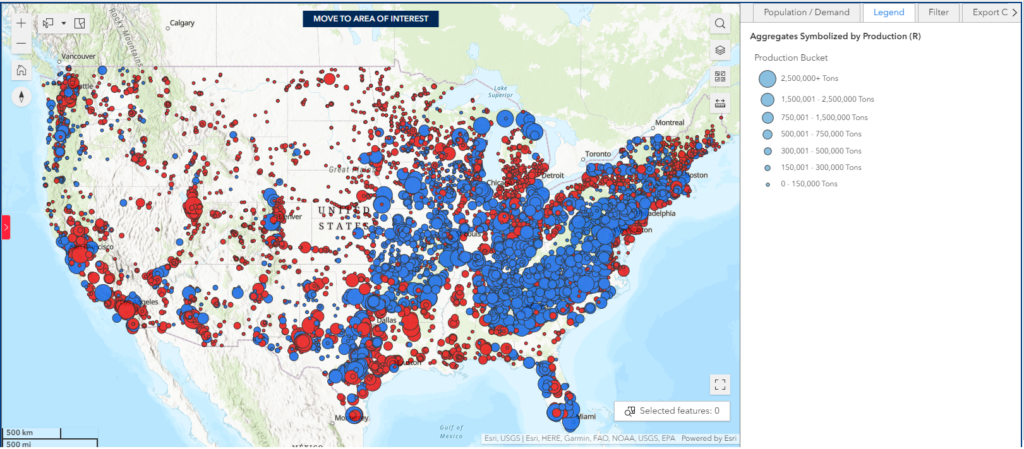
A map showing relative production sizes for crushed stone, sand, and gravel producing operations in the United States. s in the United States. This map is interactive on the Mineralocity Aggregates platform.
Brief Description: This map shows the relative side of construction aggregate producing operations throughout the United States. Blue circles are crushed stone producing operations (quarries) and red circles produce sand and gravel (pits or dredges).
Key Insights: The size of bubbles generally coincides with major population centers or rail access that ties to major urban centers. The distribution of blue and red circles is dictated by geology. You can see in the Southeastern United States, the curve of the fall line with rock above and coastal plane below with its associated sand and gravel operations. Bonus feature – Mineralocity Aggregates creates an interactive pie-chart that shows the actual market share for major producers within the map view. This is a powerful way to get a quick feel for major regional players when exploring new areas.
Business Applications: How could businesses use this information for their strategic planning? Understanding regional competition is key to discovering how to best strategically be positioned within a new market. Each region of the United States has a unique landscape of producers large and small.
5. Recycling Opportunities: The Green Goldmine
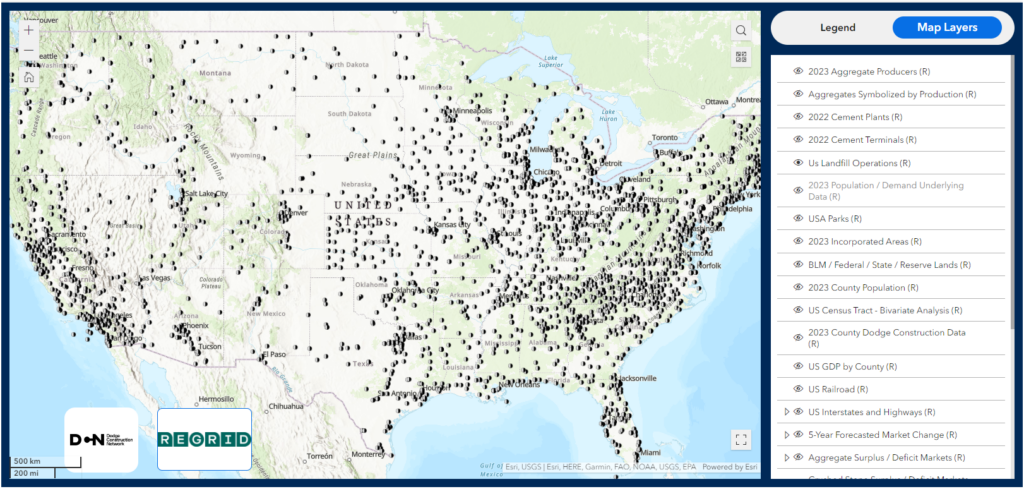
A map of all the landfill locations in the United States. This map is interactive on the Mineralocity Aggregates platform.
Brief Description: This map shows the location of every landfill location throughout the United States. This is where construction waste, ranging from excavation waste to concrete and asphalt goes to be buried and disposed of.
Key Insights: Recycled aggregate and construction waste is increasingly becoming a larger and more important aspect of the overall aggregate industry. While these recycled materials currently only account for a small percentage of overall consumed tonnage, it is likely that it will grow significantly over the next several decades. Early adapters will be positioned best to succeed.
Business Applications: Placing a recycling facility between major projects and landfills could create lucrative opportunities.
Conclusion:
These maps offer a multi-dimensional view of the construction aggregate industry, providing actionable insights for businesses eager to carve out or defend their market share. By leveraging the power of Mineralocity Aggregates’ mapping capabilities, companies can make more informed decisions that lead to sustainable growth.
Ready to dive deeper? Sign up for Mineralocity Aggregates and start exploring these maps and many more for your strategic advantage.