The construction aggregate industry is the unsung hero of the building world, playing a vital role in the production of everything from roads to skyscrapers. Despite its foundational importance, the industry is often misunderstood or overlooked by those outside it. One of the most intriguing aspects of the construction aggregate industry is the way market share and state production interact. While state production figures provide us with an idea of the total output of aggregates, the market share helps to understand how concentrated or fragmented the market is. Understanding the relationship between these two factors is crucial for both seasoned experts and industry novices. It can reveal growth opportunities and present a clearer picture of the industry landscape. Utilizing exclusive data from Mineralocity Aggregates and backed by thousands of hours of market research and analysis, this article will explore some of the dynamic between market share of the top state producers and total state production / state size to see if a correlation can be established.

The Market Share Data Snapshot by Total State Aggregate Production
Before delving into the topic, let’s take a brief look at some key data points:
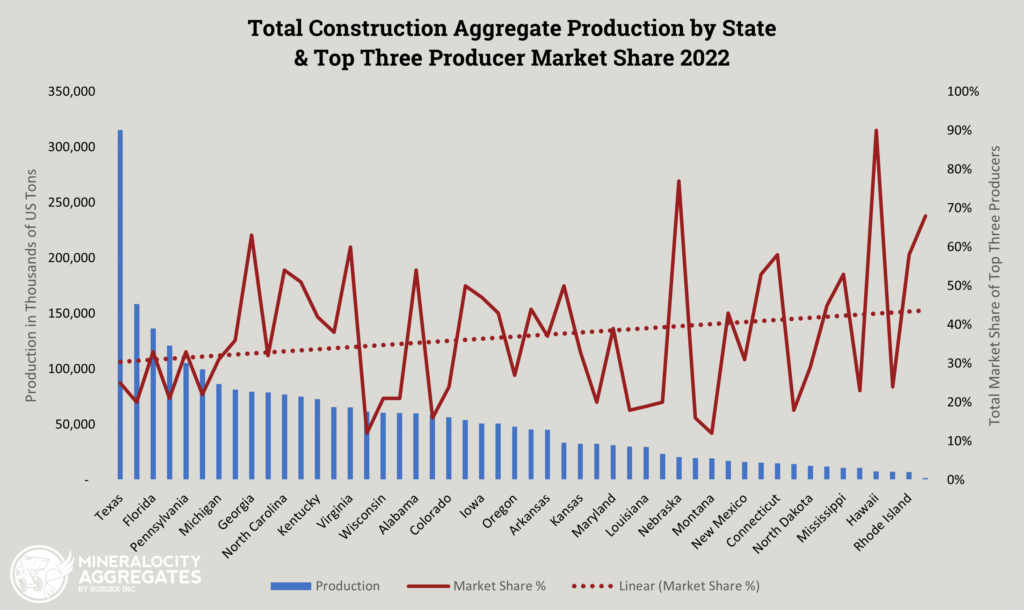
- Alabama: 60,075,895 total state production, Top producers market share: 54%
- Alaska: 7,484,685 total state production, Top producers market share: 24%
- California: 158,732,640 total state production, Top producers market share: 20%
- Connecticut: 14,991,416 total state production, Top producers market share: 58%
This is just a snapshot, but it begins to tell a compelling story.
The Market Share Correlation between Total State Production and Top Producers Market Share
High Production, Low Market Share
States like California have high production but surprisingly low market share for top producers. This suggests a more fragmented market where multiple players compete. Such landscapes often offer room for newer entrants and innovative solutions.
Low Production, High Market Share
In contrast, states like Connecticut, with 14,991,416 in total state production and a staggering 58% market share for the top producers, indicate a concentrated market. Here, new entrants will find it challenging to carve a niche. The high market share also often points to mature markets where the top players have significant leverage.
Balanced Production and Market Share
States like Alabama present a balanced picture, with a total state production of 60,075,895 and top producers controlling 54% of the market. This balance suggests that while there are dominant players, there’s still room for competition and growth.
Regional Dynamics and State Policies
The correlation is also influenced by regional dynamics and state policies. For example, the lower market share in states with high production could be a result of favorable policies that encourage competition. On the other hand, high market share in states with low production could signal strict regulations that create barriers to entry.
The Business Implications
Understanding this correlation can provide invaluable insights for business decisions:
- For Investors: Knowing which states have a balanced market share and production ratio could identify the most secure investment opportunities.
- For Existing Companies: High market share in states with high production could indicate saturated markets. Diversification might be an effective strategy.
- For New Entrants: States with high production but low market share for top producers could present untapped opportunities.
An Alternative Theory: Market Share in Relation to State Size: A New Perspective on Aggregate Production
While aggregate production is undeniably influenced by factors like market demand, availability of raw materials, and economic conditions, the role of geographic size has not likely been explored previously. Given the logistical requirements associated with the mining and transport of construction aggregates, the size of a state could be a noteworthy factor that correlates with market share distribution among top producers.
Methodology
To explore this correlation, we juxtapose data on total state production and top producer market share against the geographic size of the state. States with larger land areas may experience higher costs associated with transportation, potentially affecting the distribution of market share. Conversely, smaller states may have a more even spread among top producers due to shorter transit distances and thus, lower logistical costs.
Findings

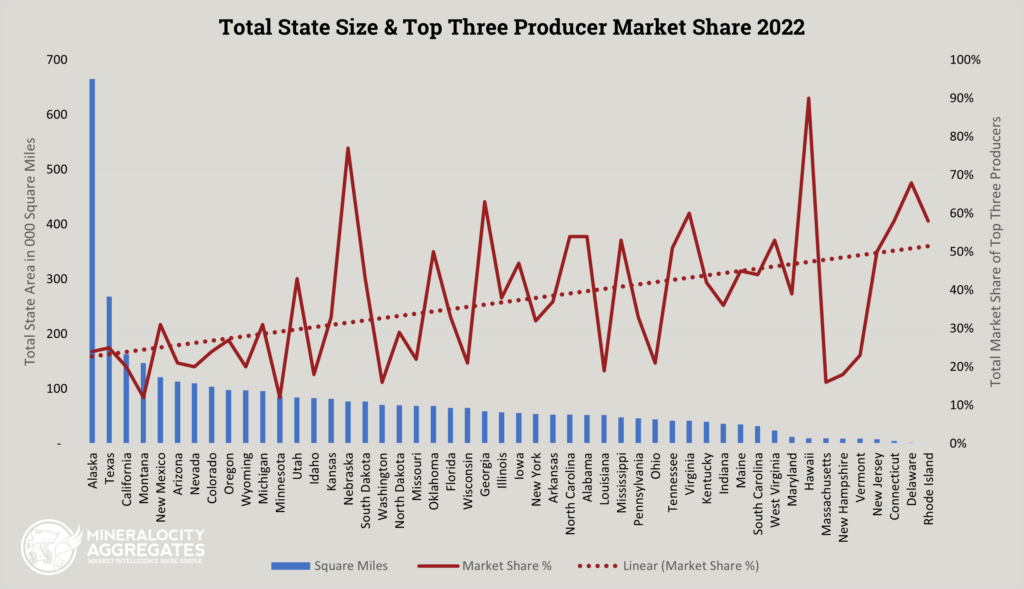
The correlation between total state size and top three producer market share appears to be stronger than the correlation between market share and total state aggregate production. This could be attributed to a number of factors, including transportation logistics and market reach of individual operations.
States with Larger Geographic Size:
- Texas 268K Mi²: Despite being one of the largest states by area, the market share among top producers is fairly distributed, with the largest producer holding only 9%. This may be due to the significant transportation distances, leading to regional monopolies rather than a single dominant player.
- California 163K Mi²: Similar to Texas, the market share in California is evenly distributed, even though it’s a large state with diverse geological features. The highest market share is 9%.
- Alaska 665K Mi²: As one of the largest states, Alaska has surprisingly low market share concentration, with the top producer holding only 11% of the market. The vast geography and complex logistics could be contributing factors – leading to many smaller independent operations instead of regional concentration.
States with Smaller Geographic Size:
- Delaware 2K Mi²: Being one of the smallest states, Delaware has a high market share concentration with the top producer holding 29% and a total of 68% market share for the top three.
- Connecticut 5K Mi²: Also a smaller state, Connecticut shows a high concentration of market share with the leading producer holding 43%.
- Rhode Island 1K Mi²: In this tiny state, market concentration is incredibly high, with the leading producer holding 32% of the market and a total market share of 58% among the top three producers.
Implications
Logistical Costs: In larger states, the logistical costs associated with transporting aggregates seem to dilute the market share of top producers and reduce the reach of each operation, requiring smaller (often independent) operations to fill the gaps.
Regional Monopolies: In larger states, it’s more likely for regional monopolies of multiple operations to exist rather than a single dominant player across the state.
High Concentration in Smaller States: The top producers in smaller states tend to have higher market shares, potentially due to lower logistical constraints and less area to cover with a single operation.
Strategic Planning: Understanding this correlation can help companies plan better for scale, market entry, or operational efficiency based on the state’s geographic size.
Conclusion
While the data points to an interesting and potentially stronger correlation between state size and market share, it’s essential to recognize that other variables such as demand, state policies, and economic conditions are also in play. However, the role of geographic size in shaping market share dynamics offers a unique lens for industry analysis, which could be particularly valuable for strategic planning.
Want to take a deeper dive into the data? Get your hands on the report that industry veterans are calling a “must-read for any serious player in the aggregate market.” Download the Mineralocity Aggregates 2022 Top Aggregate Producers Report now, and step into the future of construction aggregate business with confidence.

Unlock exclusive, groundbreaking market data with the 2022 Top Aggregate Producers Report. Don't miss out!
Gain a competitive edge with our 2022 Top Aggregate Producers Report! Get exclusive market share data on top producers in each U.S. state with market trends to strategize effectively. A must-have for every industry player!


