Contact Us Today

Mineralocity

See us at AGG1 March 25-27th, Booth 1106

02 Sep, 23

Defending and Expanding Your Market Share in the Aggregate Industry

Navigating the competitive landscape of the construction aggregate industry means being prepared for a multitude of challenges, from new competitors to economic shifts and beyond. Understanding these traditional threats to your market share is vital for long-term success. This article outlines some of these key factors and offers strategies to help you maintain and grow your market share.

The New Kid on the Block: Handling Fresh Competition

The arrival of a new competitor in the construction aggregate industry can significantly impact your business, potentially eating into your market share. These newcomers often come armed with aggressive pricing strategies, innovative products, or even a unique marketing approach, designed to lure away even your most loyal customers.

Recognize the Threat Early On

The first step in effectively countering new competition is recognizing their presence as early as possible. This can be accomplished through consistent market research, watching for permitting applications, monitoring industry publications, and even keeping an ear to the ground among your customer base and suppliers.

Conduct a Competitor Analysis

Once you’ve identified a new player in the field, a detailed competitor analysis is essential. This will help you understand their strategies, strengths, weaknesses, and most importantly, their potential impact on your market share. Your SWOT (Strengths, Weaknesses, Opportunities, and Threats) analysis should be updated to include this new competitor. This will help you identify any adjustments needed in your own value proposition.

Review and Adjust Your Value Proposition

Based on your SWOT analysis, review your value proposition to identify how you can differentiate your offering from the new competitor. This might involve enhancing product features, revising pricing structures, or improving customer service. It’s crucial to remind your customers why they chose your brand in the first place.

Monitor and Adapt

The market conditions are ever-changing, especially with a new competitor stirring the waters. Continuously monitor their strategies, customer feedback, and their impact on your market share. This is a dynamic process that will likely require you to adapt your own strategies over time.

Leverage Data Analytics

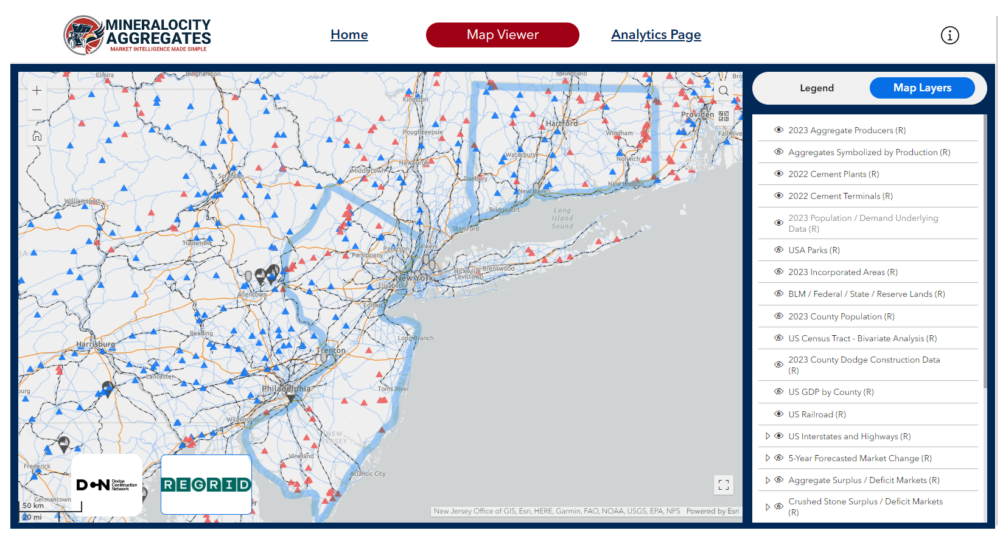
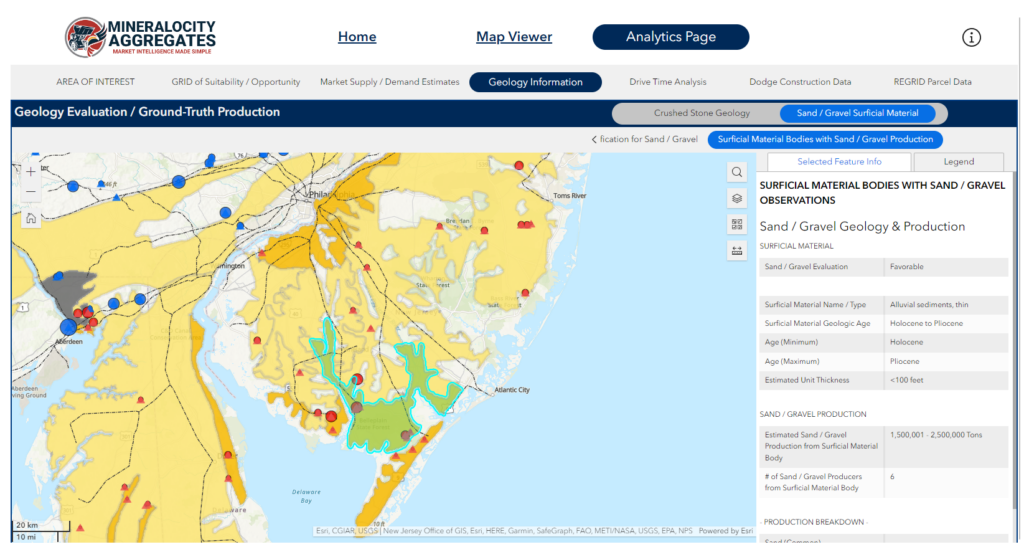
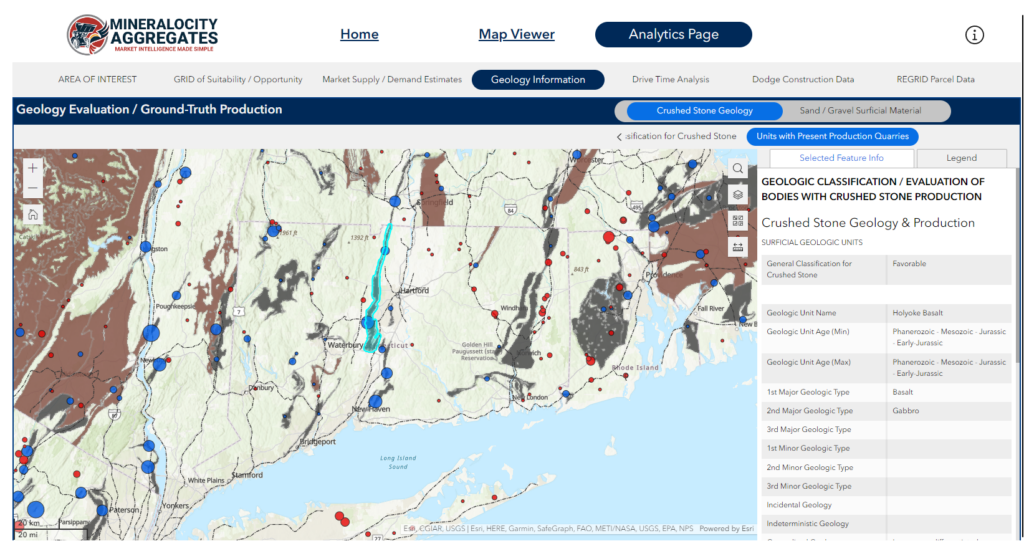
Platforms like Mineralocity Aggregates can provide data-driven insights into customer behavior, supply chain dynamics, and market trends. Utilize this data to adapt and refine your strategies for defending your market share against new competitors.

By understanding the strategies and tactics of new entrants, and responding proactively, you can mitigate the impact on your market share and even discover new opportunities for growth.

A Shaky Economy: Weathering Financial Storms

Local and regional economic conditions can dramatically affect your market share in the construction aggregate industry. Economic downturns often lead to reduced construction activities, while booms can bring about increased competition and higher operational costs. Here’s how to safeguard your market share during such uncertain times.

Recognize the Economic Indicators

Be proactive in monitoring key economic indicators relevant to your industry. These might include interest rates, unemployment levels, and construction starts. Understanding these indicators can help you predict how market demand will be affected.

Flexible Business Model

In times of economic instability, a rigid business model can be a liability. Flexibility allows you to quickly adapt to changing circumstances, whether it’s adjusting production levels, diversifying product offerings, or temporarily scaling back on certain operations.

Cash Flow Management

Maintaining a healthy cash flow is crucial, especially during economic downturns. Consider renegotiating terms with suppliers or exploring alternative financing options to bolster your liquidity. This financial cushion can provide you with the room to maneuver when times get tough.

Optimize Costs

Cost optimization is not merely about cutting expenses; it’s about making your operation leaner and more efficient. This might include improving operational efficiencies or renegotiating contracts with suppliers. Any savings can be redirected to strategies aimed at maintaining or increasing market share.

Risk Mitigation Strategies

Utilize risk management tools and strategies to prepare for potential financial downturns. This could include securing long-term contracts with favorable terms or hedging against market variables that could affect your costs, such as fuel prices.

Data-Driven Decision Making

Utilize data analytics platforms like Mineralocity Aggregates to gain insights into customer behavior, pricing elasticity, and market trends. This enables you to make informed decisions and develop adaptive strategies that can weather economic fluctuations.

By being prepared and adaptive, you can better defend your market share when economic conditions shift. Uncertain times often bring both challenges and opportunities—being agile and prepared can help you capitalize on the latter.

Project Tides: Navigating Shifts in Demand

The construction aggregate industry often faces dramatic fluctuations in demand due to the cyclical nature of large construction projects. Whether it’s the commencement of a massive infrastructure project or the winding down of a long-term development, these shifts can significantly affect your market share. Here’s how to stay ahead:

Early Intelligence Gathering

Staying informed about local and regional construction activities is essential. Subscribe to industry journals, participate in local business forums, and maintain relationships with key players to gather early intelligence about upcoming projects or project completions.

Stockpile Management

When you anticipate an increase in demand due to an upcoming project, effective stockpile management becomes critical. You may need to ramp up production in advance to meet this demand, which will also necessitate calculating storage costs and considering the shelf-life of your aggregates.

Scalable Operations

When faced with a sudden influx of large projects, your operation must be scalable. This could mean leasing additional machinery, hiring temporary labor, or partnering with other producers. Scalability allows you to capitalize on increased demand without overextending your resources.

Pricing Strategy Adjustments

Large projects might require bulk quantities but at more competitive pricing. Revisiting your pricing strategy in such cases is crucial. Offering tiered pricing or early-bird discounts can not only secure a large project but also protect your market share.

Post-Project Transition Plans

As large projects wind down, demand for aggregates will drop, sometimes significantly. Having a transition plan can help you adjust your production levels and shift your focus to other markets or smaller projects. Failing to prepare for this drop in demand can result in overstock and reduced profitability.

Data Analytics for Demand Forecasting

Platforms like Mineralocity Aggregates can offer invaluable insights for predicting future demand patterns. Utilizing predictive analytics helps you prepare for market fluctuations, allowing you to make well-informed decisions regarding production, pricing, and distribution.

By staying proactive and adaptable, you can navigate the often unpredictable tides of project-based demand, defending and even growing your market share in the process.

Conclusion: Defending and Expanding Your Market Share Amidst Traditional Threats

In a constantly evolving landscape like the construction aggregate industry, defending your market share is a never-ending task. The threats are many and varied—from new competitors disrupting the market to economic uncertainties that can shake even the most stable of businesses. On top of that, the very nature of the industry is such that demand can ramp up or plummet based on the ebb and flow of large construction projects.

Adaptability and proactivity are your best allies in such an environment. Keeping an eye out for new entrants can help you maintain your competitive edge. During uncertain economic times, a well-honed financial strategy is your best defense, helping you to survive and even thrive. Similarly, understanding the dynamics of demand, particularly during the launch or conclusion of major projects, allows for smarter stockpile management, more dynamic pricing strategies, and a better-planned operational scale.

The thread that weaves all these strategies together is data. Advanced analytics platforms like Mineralocity Aggregates offer crucial insights that can shape your strategies and decisions. These platforms allow you to predict trends, understand market dynamics, and tailor your operations in a manner that not only defends your current market share but sets the stage for future growth.

In the end, the key to successfully defending and expanding your market share lies in your ability to be proactive rather than reactive. Strategies must be continuously reviewed, plans regularly updated, and your finger always kept on the pulse of industry shifts and changes.

If you’re eager to get even more insights into defending your market share, consider booking a free demo today to learn more about the Mineralocity Aggregates platform and how you can immediately leverage its powerful insights in your business!

02 Sep, 23

Defending Market Share in the Aggregate Industry: Proactive Strategies for Producers

In the competitive landscape of the construction aggregate industry, holding onto your market share is often as challenging as expanding it. The key to retaining your slice of the pie lies in proactive strategies that span across various domains, including pricing, customer retention, and innovation. In this guide, we’ll dive into each of these critical pillars and how they can be effectively managed for defending market share in the aggregate industry.

Pricing Strategies for Defending Market Share in the Aggregate Industry

Setting the right price for your aggregates is not just a matter of arithmetic; it’s a strategy that can make or break your market share. Pricing influences not only immediate sales but also impacts long-term customer relationships. Here’s how to wield pricing as a powerful tool for defending market share in the aggregate industry:

Understanding Your Costs
Before you even think about setting a price, it’s crucial to have a clear understanding of your production and operational costs. This includes everything from raw materials to labor, transportation, and overhead. Knowing your costs sets the floor for your pricing strategy and helps avoid selling at a loss, a cornerstone principle in defending market share in the aggregate industry.

Value-Based Pricing
Gone are the days when the lowest price won the customer. Today’s buyers are increasingly looking for value, which encompasses not just the product but also the entire customer experience. Can you provide faster delivery times? Is your customer service exceptional? Are your aggregates of higher quality compared to competitors? All of these factors can justify a slightly higher price if customers perceive they are getting better value.

Dynamic Pricing Strategies: A Real-World Example
In the volatile market of construction aggregates, static pricing can be a severe disadvantage. Consider implementing dynamic pricing, where prices are adjusted based on real-time market conditions such as fluctuations in demand, seasonal trends, or competitor pricing. For instance, a mine recently required customers to purchase one ton of concrete sand (of which they had an excess) in order to purchase a ton of gravel (which was more scarce and valuable in the area). This not only enabled the mine to move inventory efficiently but also provided customers with a bundled solution, meeting multiple needs in one transaction. Such innovative strategies can be automated using advanced data analytics platforms like Mineralocity Aggregates, which closely monitor market conditions and offer valuable insights for defending market share in the aggregate industry.

Discounting and Bundle Pricing: A Tactical Edge for Defending Market Share
Strategic discounting and bundle pricing are effective ways to increase sales volumes, thereby defending or even growing your market share. For example, offering a discount for bulk orders or longer-term contracts can incentivize customers to make larger, more committed purchases.

Communication and Transparency in Pricing
Any pricing strategy is only as effective as its communication. Make sure your customers understand your pricing model, what they’re paying for, and why it offers better value. Transparency can go a long way in building trust, an essential factor in defending market share in the aggregate industry. By meticulously crafting your pricing strategies, you’re not just setting a price; you’re defining the value of your brand and product in the eyes of the customer.

Customer Retention: The Lifeline for Defending Market Share in the Aggregate Industry

Keeping an existing customer is generally cheaper and more efficient than acquiring a new one. The aggregate industry is no different. Focus on customer service, transparent communication, and reliable delivery to keep your customers coming back. Additionally, customer loyalty programs or long-term contracts can be an excellent way to secure steady business while also locking in a portion of your market share.

Innovation: The Path to Sustainable Growth and Market Defense

The saying “innovate or die” holds particularly true in the construction aggregate industry. Innovation isn’t confined to the product alone; it extends to processes, supply chain management, and even customer interaction channels. Embrace technology solutions like the Mineralocity Aggregates platform to gather data-driven insights, predict future demand, and streamline operations.

Using Data to Your Advantage: Defending Market Share with Intelligence

Platforms like Mineralocity Aggregates not only assist in predicting future trends but also offer the ability to visually compare current and future supply and demand balances side by side. In an industry where the margins can be thin, these data-backed insights can be game-changing when it comes to defending market share in the aggregate industry.

Conclusion: Integrating Strategies for Defending Market Share in the Aggregate Industry

Defending your market share requires a multifaceted approach that spans pricing, customer retention, and innovation. While each of these pillars is essential, their true power lies in their integration. Utilizing platforms like Mineralocity Aggregates can offer invaluable insights and data, ensuring that your strategies are not just reactive but proactively aligned with market dynamics.

Intrigued by the strategies discussed in this article? To learn more, download our Top Aggregate Producers Report for 2023 and get ahead in your market share defense game.

27 Aug, 23

Size Doesn’t Matter: How Connecticut and New Jersey Punch Above Their Weight in Aggregate Production

When it comes to aggregate production, bigger isn’t always better. While states like Texas and California garner much attention due to their large geographical size and abundant resources, smaller states like Connecticut and New Jersey consistently show impressive aggregate production figures. But how is it possible for these smaller states to compete with the bigger players? The answer lies in a combination of factors, including efficiency, quality, and strategic location.

Efficiency: Making the Most Out of What You've Got

Connecticut, for example, is a small state with a total aggregate production of 14,991,416. What makes this number truly noteworthy is the market share of the top producers, with CRH PLC holding 43%, O & G Industries Inc at 8%, and Rawson Materials Inc. at 7%. Despite having limited land area and resources, these companies have honed their operations to an art, squeezing every bit of value out of the materials they produce.

Quality Over Quantity: The Caliber of Aggregates

In both Connecticut and New Jersey, the quality of aggregates is another key factor that allows these states to punch above their weight. Superior geological formations offer high-quality materials that often fetch higher market prices, making these states competitive in a crowded market. New Jersey has an abundance of quality sand and gravel resources, while Connecticut has quality crushed stone available throughout narrow geological bands throughout the state. Both are illustrated within the Mineralocity Aggregates platform and shown in the screenshots below:

New Jersey has an abundance of quality construction aggregate production from sand and gravel pits. Screen shot from theMineralocity Aggregates platform.
Connecticut has both sand and gravel pits and production of crushed stone from narrow geologic units that produce quality aggregates. Screenshot from the Mineralocity Aggregates platform.

Strategic Exporting: Leveraging Geographic Location and Economic Relationships

When discussing the aggregate production success of states like Connecticut and New Jersey, it’s important to understand their economic ties with neighboring regions. This interconnectedness not only adds another layer to their capability to produce and export aggregates but also makes them key players in the broader economic landscape.

New York’s Economic Magnetism

Both New Jersey and Connecticut are deeply connected to New York, particularly New York City, the economic hub of the region. With a large commuting population traveling for work between these states and the city, there’s a constant flow of economic activity. Companies such as MetLife, Prudential Financial, and Johnson & Johnson are Fortune 500 entities headquartered in New York City, but they also have significant operations and workforce in New Jersey and Connecticut. Moreover, New Jersey serves as a major transportation hub for New York, and the Port of Newark is among the busiest ports in the United States. This facilitates the smooth transfer of aggregate materials to various markets.

Pennsylvania: The Border Trade Advantage

Pennsylvania is another vital partner that shares long borders with New Jersey and Connecticut. As major suppliers of goods and services, including aggregates, to Pennsylvania-based businesses, these states experience a beneficial economic interchange. The shared borders also mean that Pennsylvania is a notable tourist destination for people residing in both New Jersey and Connecticut, which indirectly boosts the aggregate demand for infrastructure projects. It should be noted that Pennsylvania is also a major aggregate producer for its size with an annual estimated 2022 production of over 105 million tons. 

Massachusetts: The Sectoral Synergy

Though smaller in size, Massachusetts commands significant economic importance. It is home to corporations that are giants in sectors such as life sciences, technology, and finance, like Boston Scientific and Fidelity Investments. Collaborative efforts between Massachusetts and New Jersey or Connecticut businesses are frequent, particularly in these specialized sectors. This kind of cross-border investment and collaboration extends to the aggregate industry, where the high-quality aggregates from Connecticut and New Jersey find lucrative markets.

Rhode Island: The Small Giant

Rhode Island may be the smallest New England state, but it has a significant economic footprint, hosting Fortune 500 companies like CVS Health and The Providence Journal. The sectors of manufacturing, tourism, and healthcare see particularly strong collaborations between Rhode Island and New Jersey or Connecticut businesses, creating an avenue for aggregate material exchange and investment.

Beyond the Borders

While the closest and most robust economic relationships are with neighboring New England states, New Jersey and Connecticut are not limited to these borders. Their reach extends nationally and even globally, but it’s this local interconnectedness that significantly fuels their impressive aggregate production figures.

The Future is Bright: Sustainable Practices

Both states have adopted sustainable aggregate production methods, such as recycling old concrete into new aggregate, that not only reduce the environmental impact but also contribute to efficiency.

Conclusion

The tale of Connecticut and New Jersey serves as a lesson that size doesn’t always matter. It’s a mix of efficiency, quality, and location that makes these states stand out. If you’re intrigued by these insights and want to know who else is making waves in the aggregate industry, don’t miss our Top Aggregate Producers Report for 2023. Discover how companies like Mineralocity Aggregates are shaping the future of aggregate production.

Click here to download the Top Aggregate Producers Report for 2023 and delve deeper into the fascinating world of aggregates.

Report cover for the top three construction aggregate producers in each US state.

Unlock exclusive, groundbreaking market data with the 2022 Top Aggregate Producers Report. Don't miss out!

Gain a competitive edge with our 2022 Top Aggregate Producers Report! Get exclusive market share data on top producers in each U.S. state with market trends to strategize effectively. A must-have for every industry player!

26 Aug, 23

The Correlation Between Market Share and State Production & Size in the Construction Aggregate Industry

The construction aggregate industry is the unsung hero of the building world, playing a vital role in the production of everything from roads to skyscrapers. Despite its foundational importance, the industry is often misunderstood or overlooked by those outside it. One of the most intriguing aspects of the construction aggregate industry is the way market share and state production interact. While state production figures provide us with an idea of the total output of aggregates, the market share helps to understand how concentrated or fragmented the market is. Understanding the relationship between these two factors is crucial for both seasoned experts and industry novices. It can reveal growth opportunities and present a clearer picture of the industry landscape. Utilizing exclusive data from Mineralocity Aggregates and backed by thousands of hours of market research and analysis, this article will explore some of the dynamic between market share of the top state producers and total state production / state size to see if a correlation can be established. 

The Correlation Between Market Share and State Production and Size in the Construction Aggregate Industry
There is a correlation between total construction aggregate production and top three producer market share. This is likely due to a number of factors.

The Market Share Data Snapshot by Total State Aggregate Production

Before delving into the topic, let’s take a brief look at some key data points:

  • Alabama: 60,075,895 total state production, Top producers market share: 54%
  • Alaska: 7,484,685 total state production, Top producers market share: 24%
  • California: 158,732,640 total state production, Top producers market share: 20%
  • Connecticut: 14,991,416 total state production, Top producers market share: 58%

This is just a snapshot, but it begins to tell a compelling story.

The Market Share Correlation between Total State Production and Top Producers Market Share

High Production, Low Market Share

States like California have high production but surprisingly low market share for top producers. This suggests a more fragmented market where multiple players compete. Such landscapes often offer room for newer entrants and innovative solutions.

Low Production, High Market Share

In contrast, states like Connecticut, with 14,991,416 in total state production and a staggering 58% market share for the top producers, indicate a concentrated market. Here, new entrants will find it challenging to carve a niche. The high market share also often points to mature markets where the top players have significant leverage.

Balanced Production and Market Share

States like Alabama present a balanced picture, with a total state production of 60,075,895 and top producers controlling 54% of the market. This balance suggests that while there are dominant players, there’s still room for competition and growth.

Regional Dynamics and State Policies

The correlation is also influenced by regional dynamics and state policies. For example, the lower market share in states with high production could be a result of favorable policies that encourage competition. On the other hand, high market share in states with low production could signal strict regulations that create barriers to entry.

The Business Implications

Understanding this correlation can provide invaluable insights for business decisions:

  • For Investors: Knowing which states have a balanced market share and production ratio could identify the most secure investment opportunities.
  • For Existing Companies: High market share in states with high production could indicate saturated markets. Diversification might be an effective strategy.
  • For New Entrants: States with high production but low market share for top producers could present untapped opportunities.

An Alternative Theory: Market Share in Relation to State Size: A New Perspective on Aggregate Production

While aggregate production is undeniably influenced by factors like market demand, availability of raw materials, and economic conditions, the role of geographic size has not likely been explored previously. Given the logistical requirements associated with the mining and transport of construction aggregates, the size of a state could be a noteworthy factor that correlates with market share distribution among top producers.

Methodology

To explore this correlation, we juxtapose data on total state production and top producer market share against the geographic size of the state. States with larger land areas may experience higher costs associated with transportation, potentially affecting the distribution of market share. Conversely, smaller states may have a more even spread among top producers due to shorter transit distances and thus, lower logistical costs.

Findings

A chart showing total state size and the top three construction aggregate producers by market share for 2022.
The correlation between total state size and top three producer market share appears to be stronger than the correlation between market share and total state aggregate production.

The correlation between total state size and top three producer market share appears to be stronger than the correlation between market share and total state aggregate production. This could be attributed to a number of factors, including transportation logistics and market reach of individual operations.

States with Larger Geographic Size:

  • Texas 268K Mi²: Despite being one of the largest states by area, the market share among top producers is fairly distributed, with the largest producer holding only 9%. This may be due to the significant transportation distances, leading to regional monopolies rather than a single dominant player.
  • California 163K Mi²: Similar to Texas, the market share in California is evenly distributed, even though it’s a large state with diverse geological features. The highest market share is 9%.
  • Alaska 665K Mi²: As one of the largest states, Alaska has surprisingly low market share concentration, with the top producer holding only 11% of the market. The vast geography and complex logistics could be contributing factors – leading to many smaller independent operations instead of regional concentration. 

States with Smaller Geographic Size:

  • Delaware 2K Mi²: Being one of the smallest states, Delaware has a high market share concentration with the top producer holding 29% and a total of 68% market share for the top three.
  • Connecticut 5K Mi²: Also a smaller state, Connecticut shows a high concentration of market share with the leading producer holding 43%.
  • Rhode Island 1K Mi²: In this tiny state, market concentration is incredibly high, with the leading producer holding 32% of the market and a total market share of 58% among the top three producers. 

Implications

Logistical Costs: In larger states, the logistical costs associated with transporting aggregates seem to dilute the market share of top producers and reduce the reach of each operation, requiring smaller (often independent) operations to fill the gaps.

Regional Monopolies: In larger states, it’s more likely for regional monopolies of multiple operations to exist rather than a single dominant player across the state.

High Concentration in Smaller States: The top producers in smaller states tend to have higher market shares, potentially due to lower logistical constraints and less area to cover with a single operation.

Strategic Planning: Understanding this correlation can help companies plan better for scale, market entry, or operational efficiency based on the state’s geographic size.

Conclusion

While the data points to an interesting and potentially stronger correlation between state size and market share, it’s essential to recognize that other variables such as demand, state policies, and economic conditions are also in play. However, the role of geographic size in shaping market share dynamics offers a unique lens for industry analysis, which could be particularly valuable for strategic planning.

Want to take a deeper dive into the data? Get your hands on the report that industry veterans are calling a “must-read for any serious player in the aggregate market.” Download the Mineralocity Aggregates 2022 Top Aggregate Producers Report now, and step into the future of construction aggregate business with confidence.

Report cover for the top three construction aggregate producers in each US state.

Unlock exclusive, groundbreaking market data with the 2022 Top Aggregate Producers Report. Don't miss out!

Gain a competitive edge with our 2022 Top Aggregate Producers Report! Get exclusive market share data on top producers in each U.S. state with market trends to strategize effectively. A must-have for every industry player!

26 Aug, 23

The Dynamics of Market Concentration in the Construction Aggregate Industry

Introduction

When it comes to the construction aggregate industry, the distribution of market share among leading companies can reveal much about the state of competition, barriers to entry, and opportunities for innovation. Using exclusive and proprietary data from Mineralocity Aggregates, this article sheds light on the dynamics of market concentration in the industry across different U.S. states. Specifically, we examine the contrast between states with highly concentrated markets—dominated by a handful of key players—and those with more fragmented landscapes.

A map showing Market Concentration in the Construction Aggregate Industry and market share of the top three producers in each US State.
A map showing the market concentration in the construction aggregate industry of the top three 2022 producers in each U.S. state.

High Concentration Markets in the Construction Aggregate Industry: The Few Rule the Many

Case Study: Hawaii

In Hawaii, the top three construction aggregate producers—HC&D, LLC, Hawaiian Cement, and West Hawaii Concrete—collectively hold a staggering 90% of the state’s market share. This level of concentration not only demonstrates the grip these companies have on the market but also raises questions about barriers to entry for new players.

Case Study: Nebraska

Similarly, in Nebraska, Martin Marietta Materials, Inc., Kerford Limestone Company, and CRH PLC control 77% of the market. Such a tight grip by a few companies often leads to fewer choices for consumers and could potentially affect pricing strategies.

Case Study: Rhode Island

In Rhode Island, J.R. Vinagro Corporation, Holliston Sand Company Inc, and CRH PLC dominate 58% of the market, again pointing toward high concentration. Here, the influence of these key players is evident not just in their market share but also in their capacity to shape industry trends and practices.

Fragmented Market Concentration in the Construction Aggregate Industry: The Many Rule Themselves

Case Study: Alaska

On the other end of the spectrum, Alaska’s construction aggregate market presents a contrasting picture. Here, the top three producers—Colas S A, Anchorage Sand & Gravel Company Inc, and Brice Incorporated—capture just 24% of the market. This low concentration suggests a more open market landscape, where smaller players can compete more effectively.

Case Study: Minnesota

In Minnesota, the three leading companies—Holcim Group, Martin Marietta Materials, Inc., and MDU Resources Group Inc—account for a mere 12% of the market. Such a fragmented market often encourages innovation and competition, offering more choices to consumers.

Case Study: Montana

Montana mirrors this trend with MDU Resources Group Inc, United Materials of Great Falls, Inc., and Fisher Sand & Gravel Company also holding only 12% of the market share. These statistics indicate that there are likely fewer barriers to entry and possibly more room for disruptive innovation in the state.

Conclusion

Market concentration in the construction aggregate industry across the U.S. is a tapestry of concentrated and fragmented markets, each with its own unique challenges and opportunities. While highly concentrated markets may present fewer opportunities for new entrants, they often indicate a level of stability that could be attractive to investors. On the other hand, fragmented markets could be hotbeds for innovation and diversification.

Whatever the level of market concentration in the construction aggregate industry, understanding these dynamics is crucial for anyone involved in the industry. For those looking for more in-depth analysis, the full report, available for free download, provides comprehensive insights to help you explore growth opportunities, enhance operations, and boost profitability in this demanding market.

Report cover for the top three construction aggregate producers in each US state.

Unlock exclusive, groundbreaking market data with the 2022 Top Aggregate Producers Report. Don't miss out!

Gain a competitive edge with our 2022 Top Aggregate Producers Report! Get exclusive market share data on top producers in each U.S. state with market trends to strategize effectively. A must-have for every industry player!