17 Apr, 23

Mapped: Crushed Stone, Sand, and Gravel Production

Crushed stone, sand, gravel, and other construction aggregates account for half of the industrial minerals produced in the United States.

These materials represent a $29 billion per year business in the country.

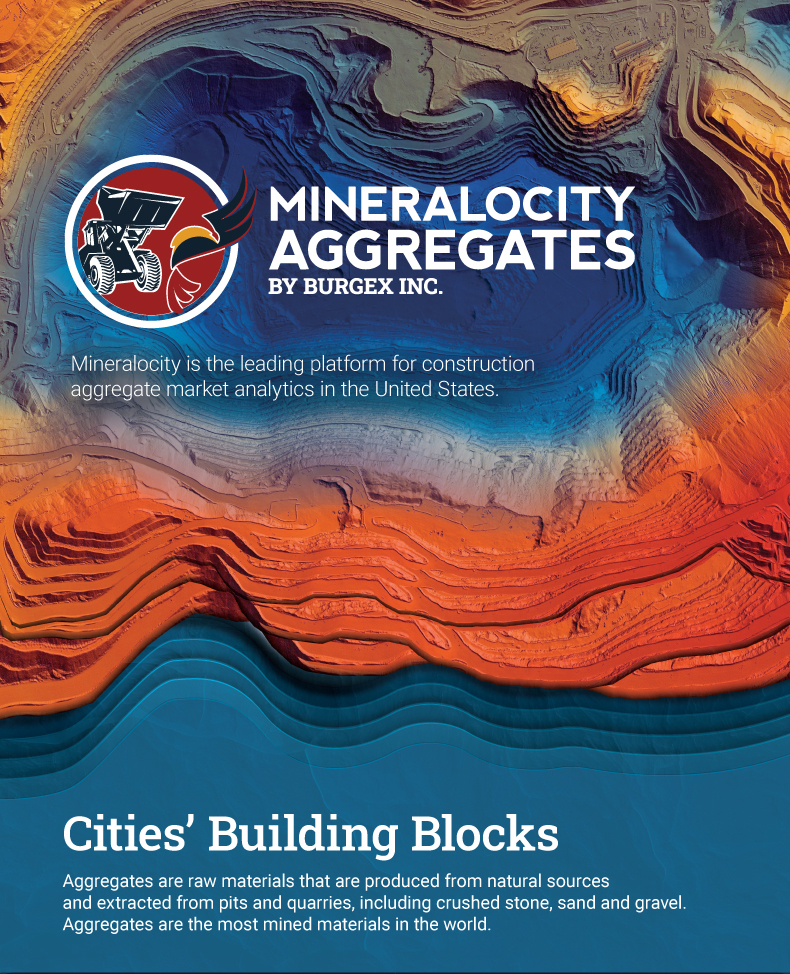
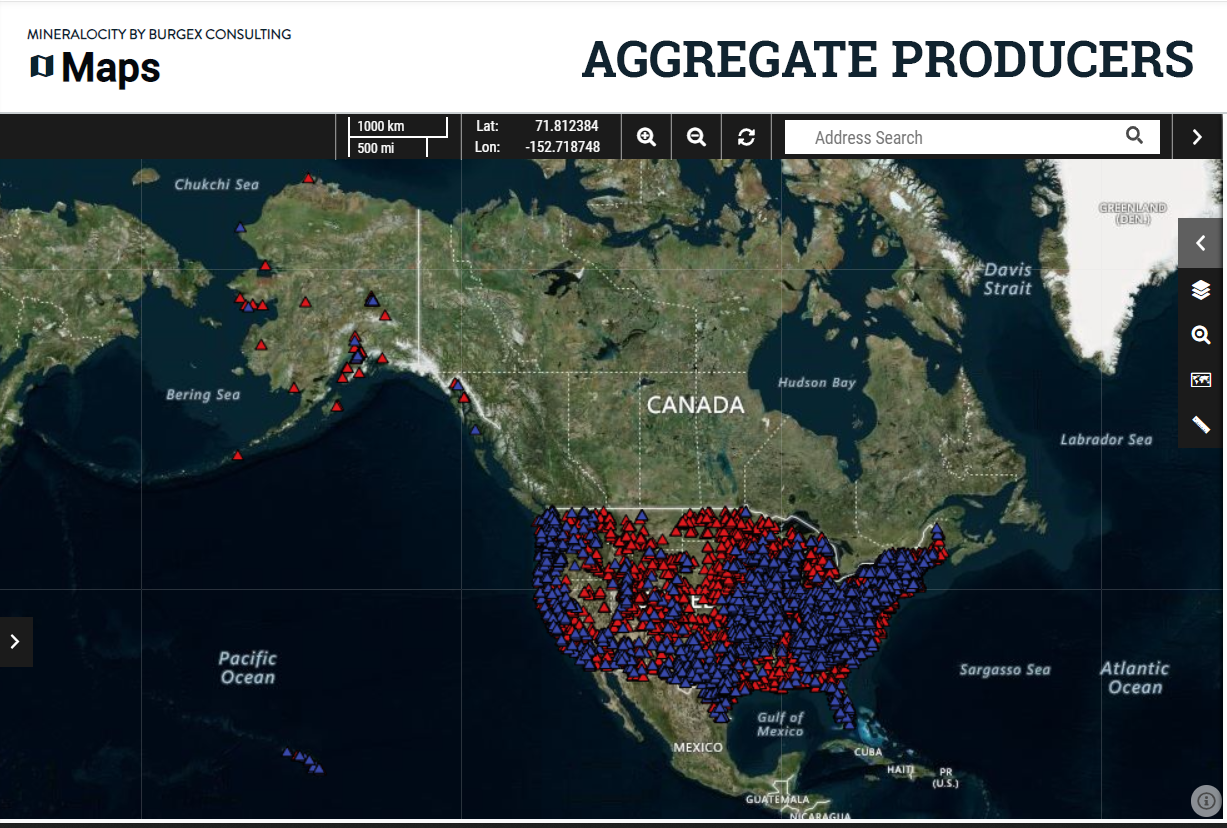
The map above from our sponsor Burgex uses data from Mineralocity to show where aggregates are produced in America.

What Are Aggregate Minerals?

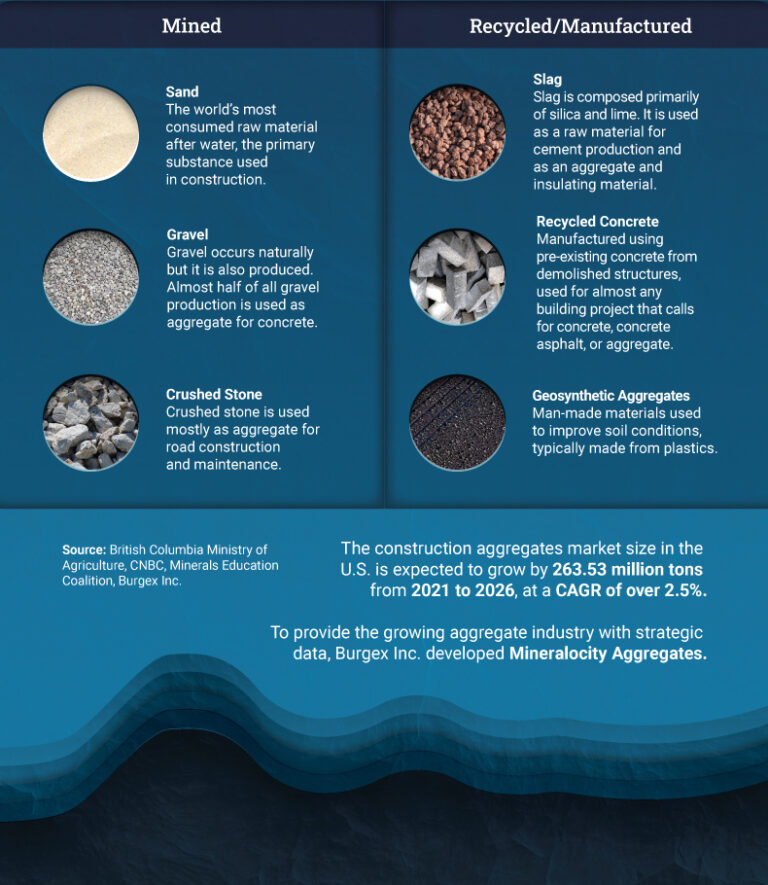
Aggregates are a variety of materials produced in pits or quarries, including sands, gravel, and crushed stone.

They are usually used in construction, with the largest proportion used to manufacture concrete.

  • Sand: The world’s most consumed raw material after water and the primary substance used in construction.
  • Gravel: It occurs naturally but it is also produced. Almost half of all gravel production is used as an aggregate for concrete.
  • Crushed Stone: Used mostly as an aggregate for road construction and maintenance. It is the leading nonfuel mineral commodity (by value of production) in America.

On average, each person in America drives demand for over 10,000 lbs of stone and around 7,000 lbs of sand and gravel per year.

Aggregate Production by State

Ten states produce more than 50% of the country’s construction aggregates.

The five leading States are, in descending order of total output: Texas, California, Florida, Ohio, and Pennsylvania.

Over 7,000 U.S. commercial aggregate companies are currently operating.

Growing urban areas across the U.S. and the rise in high-rise structures, which use concrete extensively, are expected to continue boosting demand for aggregates.

Additionally, maintenance of aging infrastructure across the country is expected to support the demand. In 2011, a study by the United States Geological Survey concluded that one-third of America’s major roads were in poor or mediocre condition, and over one-quarter of the bridges were either structurally deficient or functionally obsolete.

In this scenario, the aggregates market in the U.S. is expected to grow by 263.53 million tons from 2021 to 2026, at an annual average growth rate of over 2.5%.

Ready to Unlock the Secrets of Successful Greenfield Site Evaluation?

Dive deeper into the world of construction aggregate production with our exclusive Greenfield Guide. Whether you’re a seasoned expert or just embarking on your aggregate adventure, this guide is your roadmap to identifying prime locations, assessing supply potential, and capturing significant market shares. Arm yourself with proven strategies, actionable insights, and essential formulas designed to propel your projects to unparalleled success. Don’t miss this chance to elevate your greenfield endeavors – grab your free copy of the Greenfield Guide now! 

12 Apr, 23

Visualizing One Year of Sand, Gravel, and Stone Consumption in the U.S.

Aggregate minerals, which include raw materials such as sand, gravel, and stone, are the building blocks of our cities and an integral part of the U.S. economy.

From being used to make the concrete that shapes our buildings to being the foundation of our roads, aggregates are necessary to maintain our quality of life. But just how much do we rely on these raw materials each year?

To explore the answer, this visualization from our sponsor Burgex uses forecast data from Mineralocity Aggregates to show how much crushed stone, sand, and gravel the U.S. is expected to consume in 2023.

Crushed Stone

Crushed stone is a versatile material that has a variety of uses in road and building construction, landscaping, and other industries. It is typically made from various types of rock, such as limestone, dolomite, and granite, that have been broken down into different sizes.

According to projections by Minerolocity Aggregates, the U.S. will consume 1.73 billion U.S. tons of crushed stone in 2023.

Taking its 100 lb/ft³ density into account, that is equivalent to a cube 3,259 feet high. That’s nearly double the height of the One World Trade Center, the tallest building in the U.S., standing at 1,776 feet as an homage to the country’s Declaration of Independence.

It’s also worth considering per capita usage to grasp the magnitude of aggregates we depend on in our daily lives. In 2023, each American is projected to account for the consumption of approximately 5.2 tons of crushed stone.

While crushed stone production is prevalent across the United States, here are some states that sold the most of this aggregate mineral in 2021.

State2021 Crushed Stone Sales in Thousands of U.S. Tons
Texas187,393
Florida104,609
Pennsylvania96,673
Ohio77,052
California56,218

With 99% of all U.S. demand being met by domestic production in 2022, crushed stone is an integral part of the U.S. economy.

Sand and Gravel

Sand and gravel are essential natural resources that are widely used in construction and agriculture. They also have wide uses in industrial activities, such as glass manufacturing, foundries, and metal casting, as well as in recreational activities, such as volleyball courts, golf courses, and beaches.

In 2023, the U.S. is forecasted to consume 1.12 billion U.S. tons of sand and gravel. This is more than 3.3 tons per person. 

Here are the top producers of sand and gravel in the United States.

State2021 Sand and Gravel Sales in Thousands of U.S. Tons
California125,663
Texas104,940
Ohio38,801
Florida23,920
Pennsylvania7,529

Aggregate minerals are the building blocks of our modern lives.

With over 7,000 commercial aggregate companies operating in the U.S. (while contributing $31 billion to the economy in 2022), their importance to our lives and the economy should not be underestimated.

13 Jan, 23

Dodge Construction Network’s Dataset now Integrated With Mineralocity Aggregates

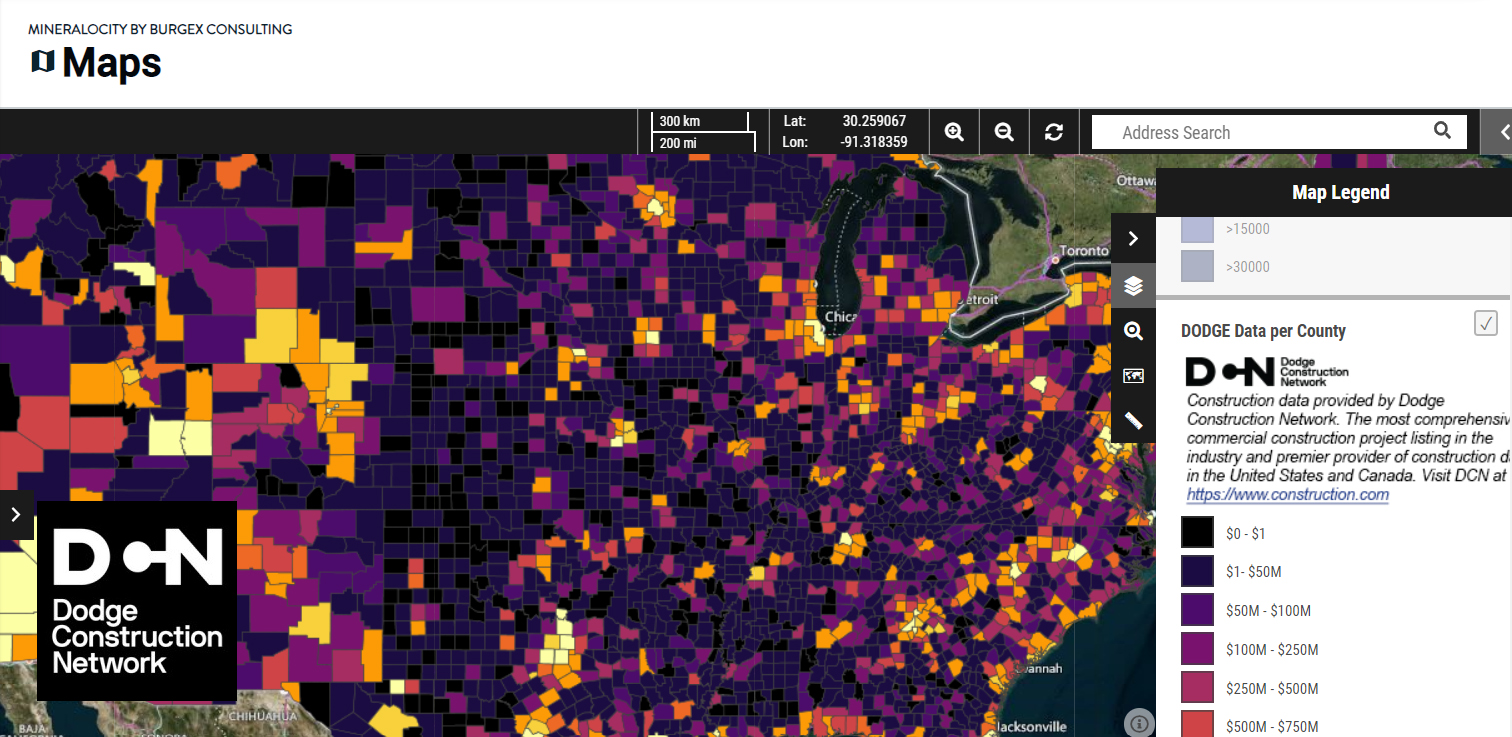
Mineralocity Aggregates is excited to announce a new strategic partnership with Dodge Construction Network, the leading provider of construction market intelligence. This partnership allows us to provide our customers with valuable insights into future construction aggregate demand.

The dataset includes location-based information on where construction dollars will be spent and where aggregate demand is heading. This type of information is essential for businesses in the construction aggregates industry as it helps them make informed decisions about where to invest their resources. The dataset is now live on the Mineralocity Aggregates platform and available for all current subscribers to use.

This partnership is a game-changer for the construction aggregates industry. Never before has such detailed and accurate information about future aggregate demand been available. With this new data, our subscribers will have a clear advantage over their competitors, as they will be able to anticipate market trends and adjust their strategies accordingly.

The partnership with Dodge Construction Network is just the latest example of Mineralocity Aggregates’ commitment to providing our subscribers with the most advanced market intelligence available. We are constantly working to expand and improve our datasets, so that our subscribers have the tools they need to succeed in the competitive construction aggregates industry.

We are thrilled to offer this new dataset to our subscribers and are confident that it will have a significant impact on the construction aggregates industry. We look forward to seeing the positive results it will bring for our subscribers’ businesses.

Dodge Construction Network provides the most comprehensive commercial construction project listing in the industry and is the premier provider of construction data in the United States and Canada. Visit DCN to learn more at https://www.construction.com 

If you’re not already a subscriber, sign up today to gain access to this valuable new dataset and start using it to make better decisions for your business. We are excited to see how you will use this new data to drive growth and success.

Ready to Unlock the Secrets of Successful Greenfield Site Evaluation?

Dive deeper into the world of construction aggregate production with our exclusive Greenfield Guide. Whether you’re a seasoned expert or just embarking on your aggregate adventure, this guide is your roadmap to identifying prime locations, assessing supply potential, and capturing significant market shares. Arm yourself with proven strategies, actionable insights, and essential formulas designed to propel your projects to unparalleled success. Don’t miss this chance to elevate your greenfield endeavors – grab your free copy of the Greenfield Guide now! 

12 Aug, 22

WHAT IS MINERALOCITY AGGREGATES – A SIMPLE BREAKDOWN OF THE CORE DATASETS AND THEIR USES BY: STUART BURGESS

I’ll be candid – I’ve written a lot about Mineralocity Aggregates over the last six months, but I recently found out from an industry colleague that much of what I’ve written is overly technical or doesn’t adequately explain WHAT Mineralocity Aggregates is and how it can be used by those in and around the aggregate industry. This article is my attempt to rectify that, here we go!

All Commercial Aggregate Producers Mapped – Throughout the Entire United States

Mineralocity Locations

Mineralocity Aggregates has all 7,000+ commercial construction aggregates (sand, gravel, crushed stone) producers mapped out. This information is useful for those who are looking to source coarse or fine aggregate materials (construction contractors), those who are evaluating different markets to expand and start production of construction aggregates (active and potential producers), and others.

Some examples of how these mapped aggregate producers could be used are:

  • Locating sources for fine or coarse aggregate materials near a construction site
  • Identifying areas where there is a lack of current aggregate production
  • Identifying potential customers for suppliers to the aggregate industry – from explosives to tires and even consulting services
Aggregate Demand Estimated and Mapped

Aggregate Demand

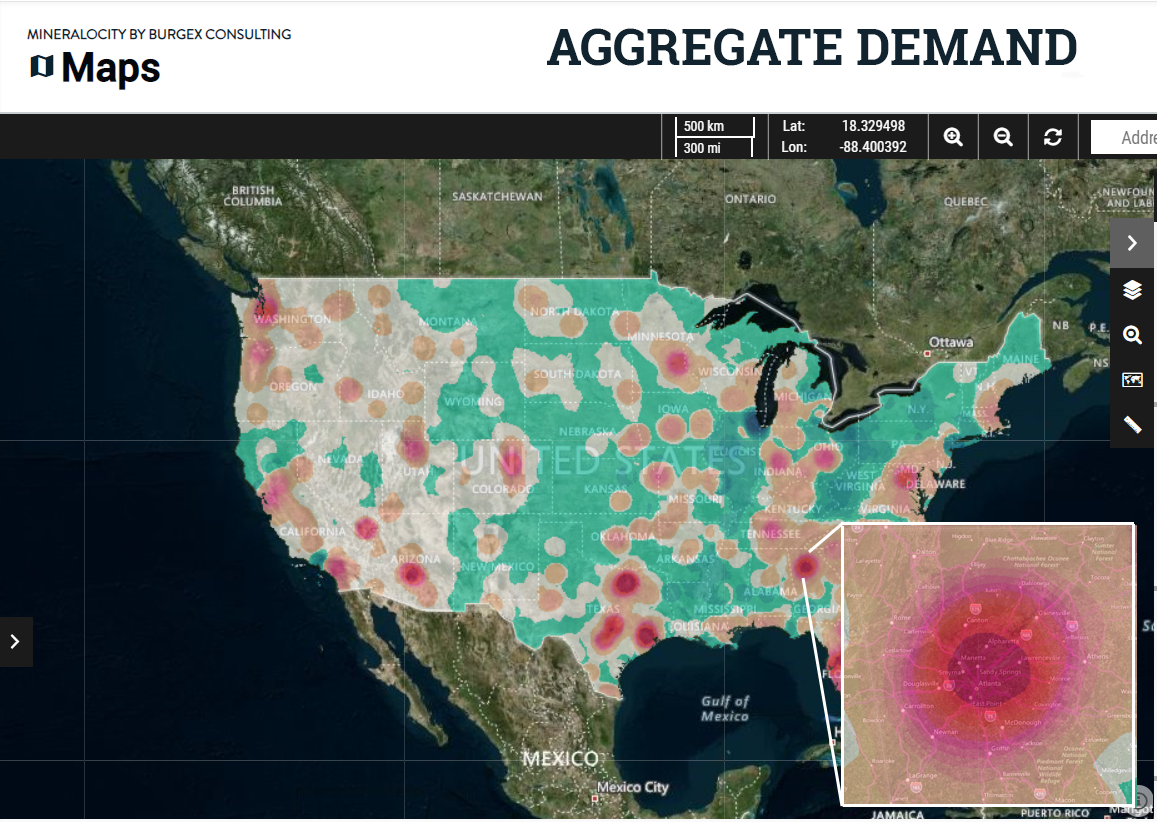
Mineralocity Aggregates contains a very accurate proprietary population model that is used to estimate construction aggregates demand – locally, regionally, and nationwide. This demand can be visualized and explored in a variety of ways within the platform. This is especially useful for current and potential producers who are looking to scale existing or start new operations. This data is also useful for aggregate industry associations, government entities, and others who are seeking to better understand the flow of construction materials.

Some examples of how aggregate demand can be used:

  • Locating areas with good potential for starting a new pit or quarry
  • Optimizing existing operations to explore new portions of the local market
  • Evaluating long term local and regional planning needs
Aggregate Supply Estimated and Mapped

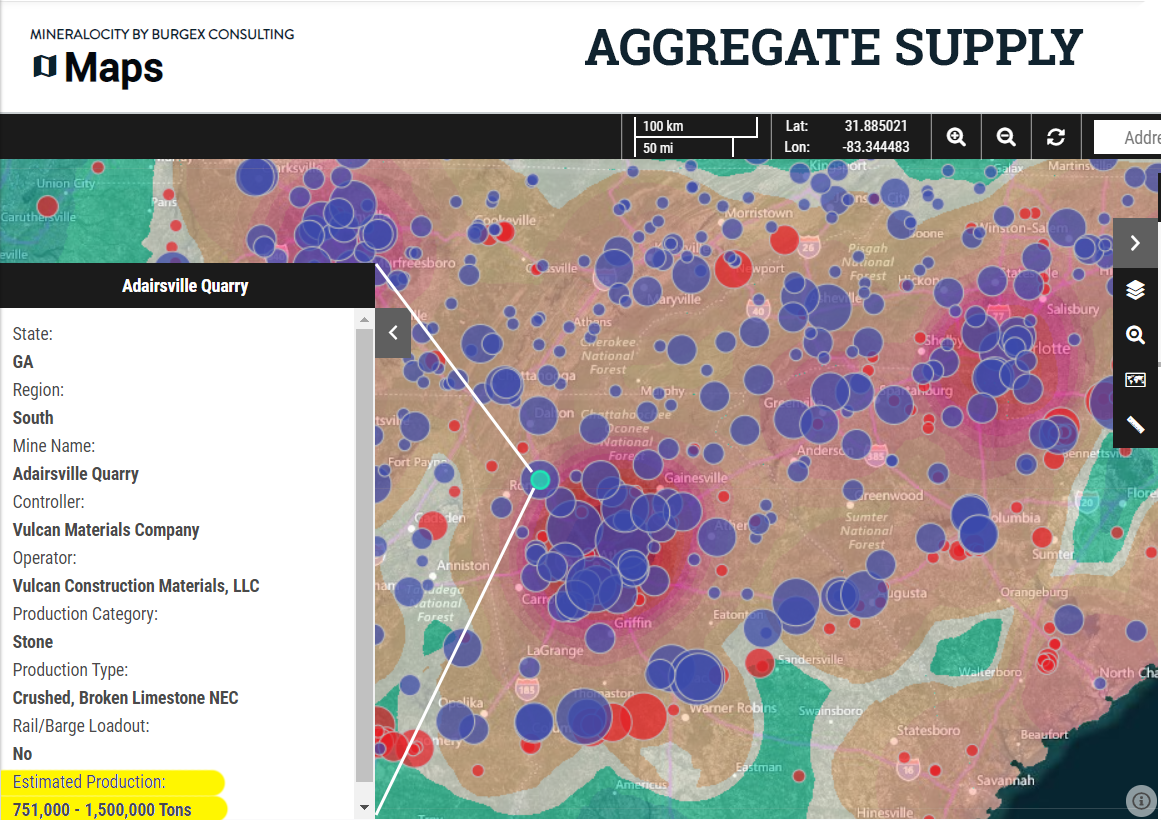
In addition to having construction aggregate demand mapped, the Mineralocity Aggregates platform also contains estimated supply from each of the 7000+ mapped operations and the impact of that supply within the trucking market region. This supply can be explored in a variety of ways, from clicking on each quarry individually to get an estimated production range, to exploring the market of a very specific location to generate an estimated balance of supply and demand.

Some examples of how aggregate supply can be used include:

  • Evaluating the performance and market dominance of competitors
  • Identifying areas of supply deficit that could support a new quarrying operation
  • Identifying and classifying potential customers for suppliers to the aggregates industry
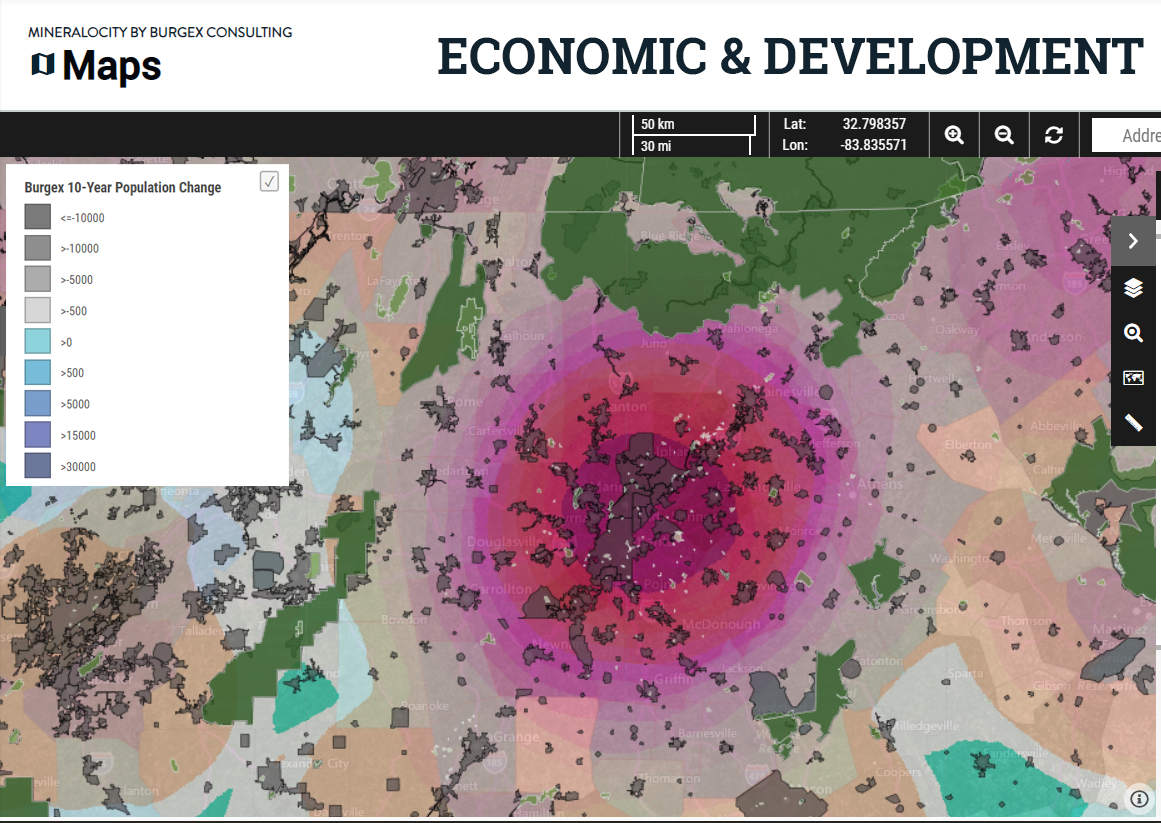
Regional Economic, Development, and Geologic Information

Mineralocity Aggregates contains a variety of economic market intelligence that can be explored and visualized. This information ranges from the mapping of housing permits to growth projections. This information is useful to further explore potential regions that are primed for development of construction aggregates. The platform also contains layers that display general geology and favorable geology for production of fine and coarse aggregates. Some features even include interactive estimated production within specific geologic units – which is very helpful for identifying a good quarry location.

This regional economic information can be used to:

  • Explore high growth areas – or areas of future growth that could support quarry development
  • Identify areas of potential supply deficit that could warrant scaling an existing operation
  • Generating data rich presentations that can be used to present opportunities – for industry associations, to governments, and producers.
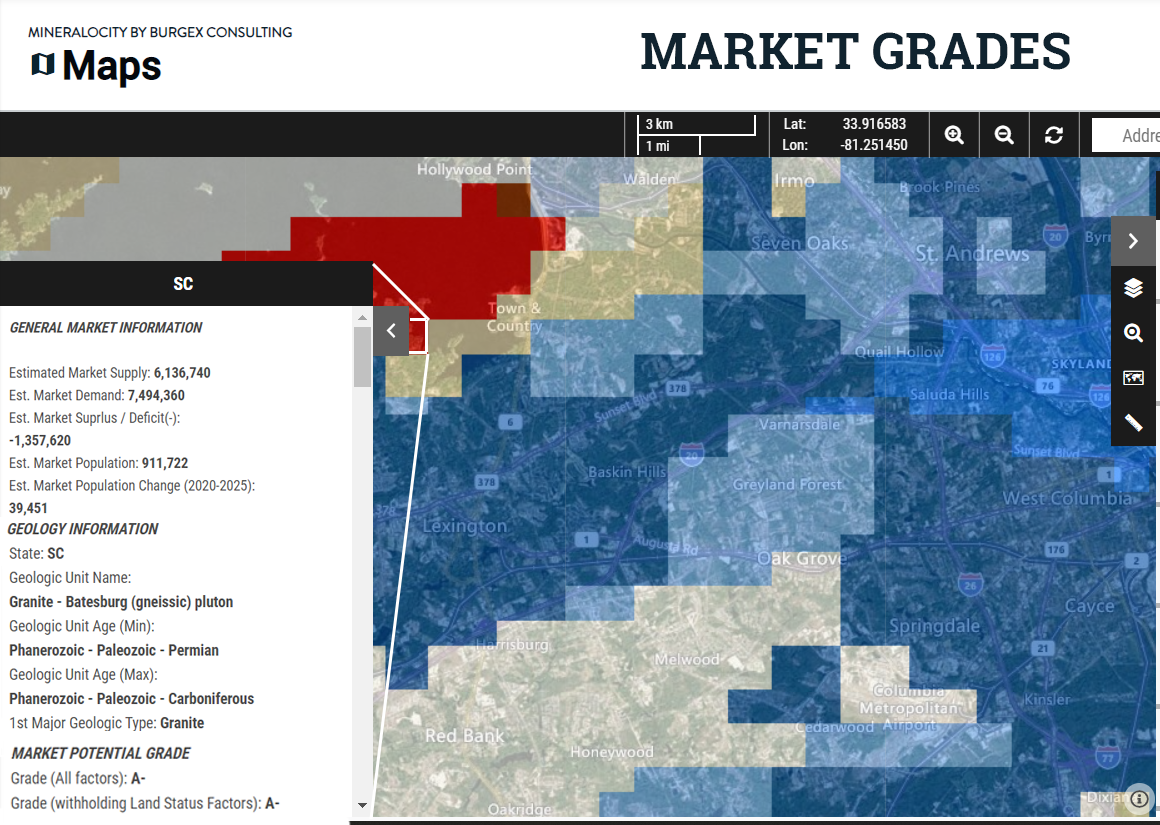
Putting it all Together –Market Grades

If you are looking for a quick way to evaluate a specific location and get a snapshot of current and future market conditions, the Market Grades layer is the first one to check. This layer ranks specific  locations on a simple A – F scale that factors everything from supply and demand to geology and even things like permitting difficulty and development potential. Clicking on a specific location – down to ½ mile squares – will open up a table that contains a host of useful information on the market, economics, geology, etc.

The Burgex Market Grades can be used to:

  • Quickly identify areas that are economically suitable for locating a quarry
  • Identify regions that have future opportunities for development
  • Explore the technical feasibility of opening a new quarry location
Conclusion

The Mineralocity Aggregates Platform provides market intelligence on the construction aggregates industry that is mapped and can be visualized and interactively explored – think Google Earth specifically designed for the aggregates industry. The tools and datasets available on the platform are constantly growing and more features are being added on a regular basis. Look for exciting new updates soon that further expand its usefulness – check it out for yourself at: https://mineralocity.com/ and you will see that it really is the future of aggregate market intelligence.