Contact Us Today

Mineralocity

See us at AGG1 March 25-27th, Booth 1106

27 Aug, 23

Size Doesn’t Matter: How Connecticut and New Jersey Punch Above Their Weight in Aggregate Production

When it comes to aggregate production, bigger isn’t always better. While states like Texas and California garner much attention due to their large geographical size and abundant resources, smaller states like Connecticut and New Jersey consistently show impressive aggregate production figures. But how is it possible for these smaller states to compete with the bigger players? The answer lies in a combination of factors, including efficiency, quality, and strategic location.

Efficiency: Making the Most Out of What You've Got

Connecticut, for example, is a small state with a total aggregate production of 14,991,416. What makes this number truly noteworthy is the market share of the top producers, with CRH PLC holding 43%, O & G Industries Inc at 8%, and Rawson Materials Inc. at 7%. Despite having limited land area and resources, these companies have honed their operations to an art, squeezing every bit of value out of the materials they produce.

Quality Over Quantity: The Caliber of Aggregates

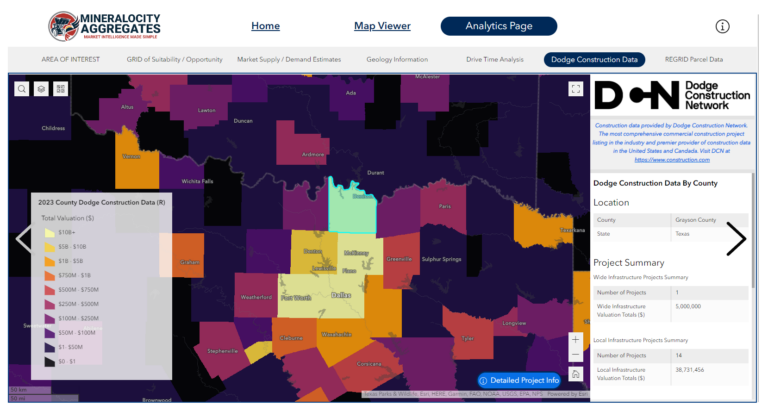
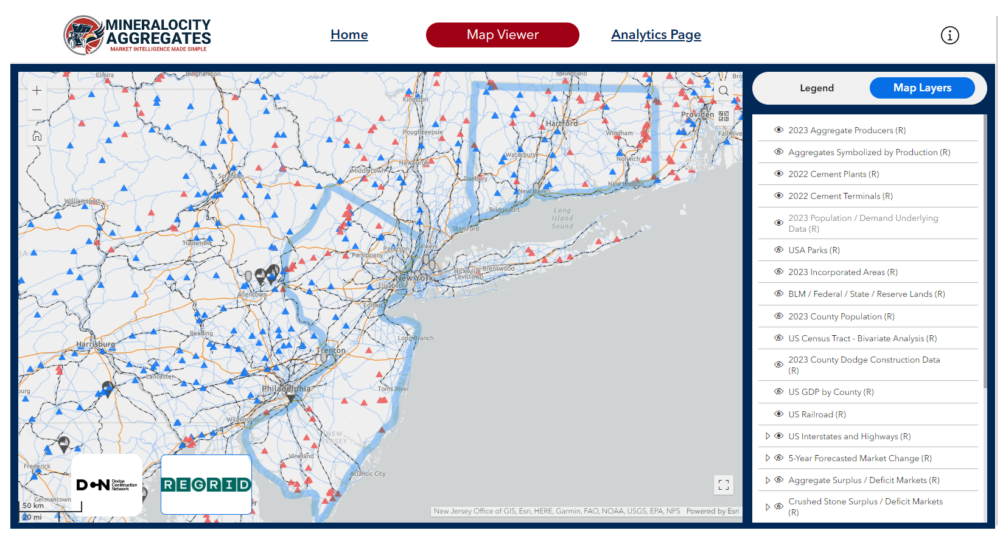
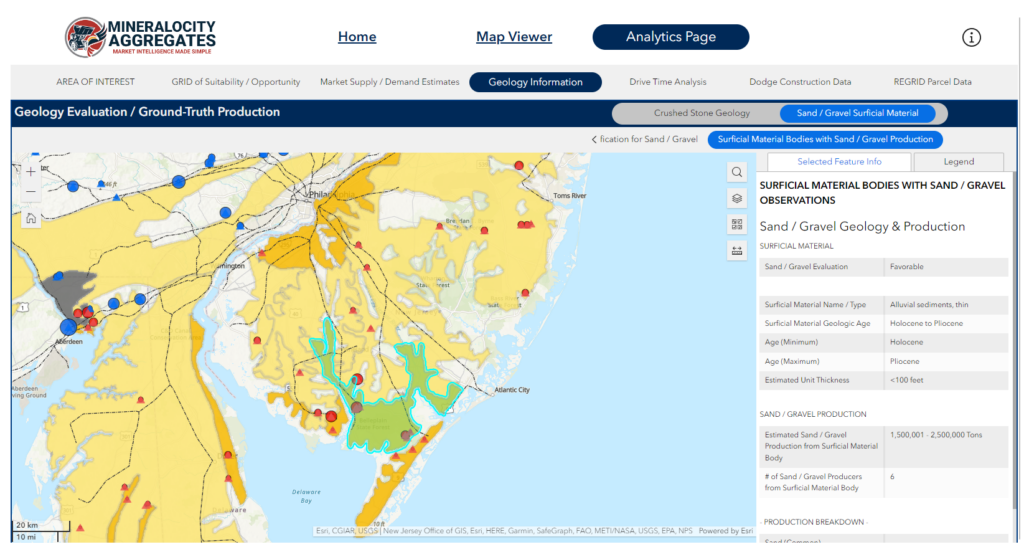
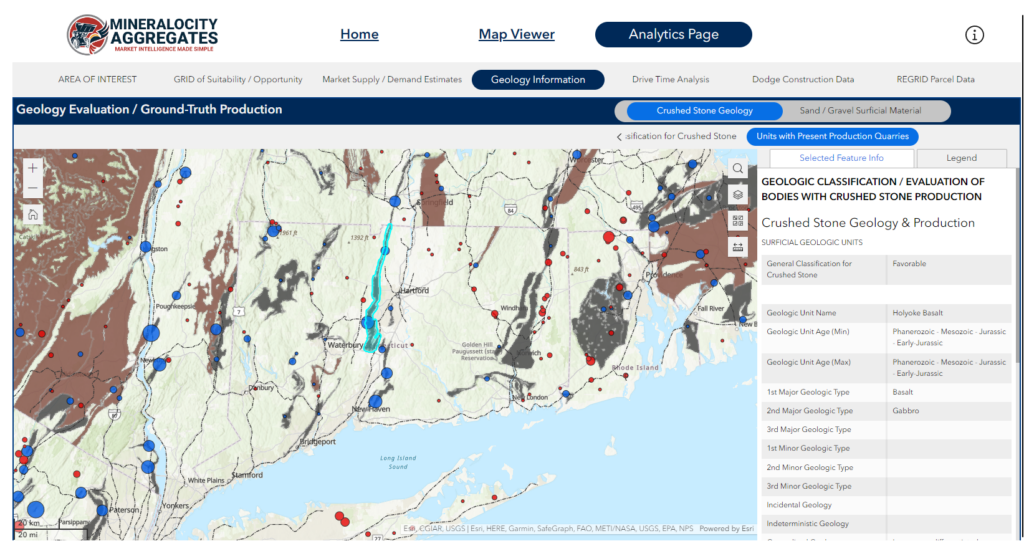
In both Connecticut and New Jersey, the quality of aggregates is another key factor that allows these states to punch above their weight. Superior geological formations offer high-quality materials that often fetch higher market prices, making these states competitive in a crowded market. New Jersey has an abundance of quality sand and gravel resources, while Connecticut has quality crushed stone available throughout narrow geological bands throughout the state. Both are illustrated within the Mineralocity Aggregates platform and shown in the screenshots below:

New Jersey has an abundance of quality construction aggregate production from sand and gravel pits. Screen shot from theMineralocity Aggregates platform.
Connecticut has both sand and gravel pits and production of crushed stone from narrow geologic units that produce quality aggregates. Screenshot from the Mineralocity Aggregates platform.

Strategic Exporting: Leveraging Geographic Location and Economic Relationships

When discussing the aggregate production success of states like Connecticut and New Jersey, it’s important to understand their economic ties with neighboring regions. This interconnectedness not only adds another layer to their capability to produce and export aggregates but also makes them key players in the broader economic landscape.

New York’s Economic Magnetism

Both New Jersey and Connecticut are deeply connected to New York, particularly New York City, the economic hub of the region. With a large commuting population traveling for work between these states and the city, there’s a constant flow of economic activity. Companies such as MetLife, Prudential Financial, and Johnson & Johnson are Fortune 500 entities headquartered in New York City, but they also have significant operations and workforce in New Jersey and Connecticut. Moreover, New Jersey serves as a major transportation hub for New York, and the Port of Newark is among the busiest ports in the United States. This facilitates the smooth transfer of aggregate materials to various markets.

Pennsylvania: The Border Trade Advantage

Pennsylvania is another vital partner that shares long borders with New Jersey and Connecticut. As major suppliers of goods and services, including aggregates, to Pennsylvania-based businesses, these states experience a beneficial economic interchange. The shared borders also mean that Pennsylvania is a notable tourist destination for people residing in both New Jersey and Connecticut, which indirectly boosts the aggregate demand for infrastructure projects. It should be noted that Pennsylvania is also a major aggregate producer for its size with an annual estimated 2022 production of over 105 million tons. 

Massachusetts: The Sectoral Synergy

Though smaller in size, Massachusetts commands significant economic importance. It is home to corporations that are giants in sectors such as life sciences, technology, and finance, like Boston Scientific and Fidelity Investments. Collaborative efforts between Massachusetts and New Jersey or Connecticut businesses are frequent, particularly in these specialized sectors. This kind of cross-border investment and collaboration extends to the aggregate industry, where the high-quality aggregates from Connecticut and New Jersey find lucrative markets.

Rhode Island: The Small Giant

Rhode Island may be the smallest New England state, but it has a significant economic footprint, hosting Fortune 500 companies like CVS Health and The Providence Journal. The sectors of manufacturing, tourism, and healthcare see particularly strong collaborations between Rhode Island and New Jersey or Connecticut businesses, creating an avenue for aggregate material exchange and investment.

Beyond the Borders

While the closest and most robust economic relationships are with neighboring New England states, New Jersey and Connecticut are not limited to these borders. Their reach extends nationally and even globally, but it’s this local interconnectedness that significantly fuels their impressive aggregate production figures.

The Future is Bright: Sustainable Practices

Both states have adopted sustainable aggregate production methods, such as recycling old concrete into new aggregate, that not only reduce the environmental impact but also contribute to efficiency.

Conclusion

The tale of Connecticut and New Jersey serves as a lesson that size doesn’t always matter. It’s a mix of efficiency, quality, and location that makes these states stand out. If you’re intrigued by these insights and want to know who else is making waves in the aggregate industry, don’t miss our Top Aggregate Producers Report for 2023. Discover how companies like Mineralocity Aggregates are shaping the future of aggregate production.

Click here to download the Top Aggregate Producers Report for 2023 and delve deeper into the fascinating world of aggregates.

Report cover for the top three construction aggregate producers in each US state.

Unlock exclusive, groundbreaking market data with the 2022 Top Aggregate Producers Report. Don't miss out!

Gain a competitive edge with our 2022 Top Aggregate Producers Report! Get exclusive market share data on top producers in each U.S. state with market trends to strategize effectively. A must-have for every industry player!

26 Aug, 23

4 U.S. Counties Poised for Explosive Growth in Construction Aggregate Demand

When it comes to the construction aggregate industry, knowing where to focus your attention and resources can be half the battle. Thanks to exclusive data from Dodge Construction Network, and rigorous analysis on the Mineralocity Aggregates platform, we’re spotlighting four U.S. counties where future demand for construction aggregates is poised to skyrocket.

Grayson County, Texas

Total Projects: 92

Total Valuation: $30 Billion

  • Wide Infrastructure Projects: 1 ($5 Million)
  • Local Infrastructure Projects: 14 ($38.73 Million)
  • Local Non-Residential Projects: 77 ($29.99 Billion)

Grayson County is a hidden gem, with a total valuation of $30 billion in potential projects, setting the stage for immense construction aggregate demand in the near future.

San Bernardino County, California

Total Projects: 991

Total Valuation: $20.37 Billion

  • Wide Infrastructure Projects: 6 ($439 Million)
  • Local Infrastructure Projects: 40 ($519 Million)
  • Local Non-Residential Projects: 945 ($19.4 Billion)

San Bernardino is a hive of construction activity with almost a thousand projects valued at over $20 billion. It’s a potential goldmine for construction aggregate suppliers.

Maricopa County, Arizona

Total Projects: 2,319

Total Valuation: $106.64 Billion

  • Wide Infrastructure Projects: 70 ($887 Million)
  • Local Infrastructure Projects: 202 ($901 Million)
  • Local Non-Residential Projects: 2,047 ($105 Billion)

In Maricopa, the numbers are staggering. With a colossal valuation exceeding $106 billion, this county is on the cusp of unprecedented growth in construction aggregate demand.

Cook County, Illinois

Total Projects: 710

Total Valuation: $77 Billion

  • Wide Infrastructure Projects: 28 ($347 Million)
  • Local Infrastructure Projects: 166 ($422 Million)
  • Local Non-Residential Projects: 516 ($76.2 Billion)

Cook County’s diversity in project types and a valuation of $77 billion make it a hotbed for construction aggregate demand, ranging from infrastructural to non-residential projects.

Construction data provided by Dodge Construction Network. The most comprehensive commercial construction project listing in the industry and premier provider of construction data in the United States and Canada. Visit DCN at https://www.construction.com

This invaluable data has been exclusively analyzed on the Mineralocity Aggregates platform and mapped out for every U.S. county to forecast future construction aggregate-intensive projects—projects that haven’t yet started but have a high likelihood of occurring.

Ready to Unlock the Future of Construction Aggregate Demand?

These are just a few examples. Imagine the opportunities waiting to be discovered nationwide! With a subscription to Mineralocity Aggregates, you gain access to an incredibly powerful tool designed to identify potential areas of growth and future construction aggregate demand. What are you waiting for? Dive into a world of opportunity. Book your live demo now. Don’t miss your chance to be ahead of the curve.

Report cover for the top three construction aggregate producers in each US state.

Unlock exclusive, groundbreaking market data with the 2022 Top Aggregate Producers Report. Don't miss out!

Gain a competitive edge with our 2022 Top Aggregate Producers Report! Get exclusive market share data on top producers in each U.S. state with market trends to strategize effectively. A must-have for every industry player!

19 Jul, 23

Analysis of Per-Capita Consumption Trends for Construction Aggregates in the U.S. (2012-2022)

In the realm of construction, aggregates stand as a cornerstone material. For the U.S., understanding consumption trends of these aggregates on a per-capita basis offers key insights into the construction industry’s health, the evolution of urbanization, infrastructure development, and the nation’s overall economic momentum.

A Rising Demand

From the data provided by the USGS and US Census Bureau, spanning 2012 to 2022, there’s a distinct upward trajectory in the per-capita consumption of construction aggregates. Starting at a consumption of 6.961 tons per person in 2012, the decade saw a peak of 8.024 tons by 2021. While the average per-capita consumption over this period was 7.56 tons, the growth trend is clear, representing an increase of roughly 15% from 2012 to 2021.

Population vs. Production

A table showing us aggregate production, population data, and per-capita aggregate consumption trends.
Decade in Review: Per-Capita Construction Aggregate Consumption in the U.S. (2012-2022)

Throughout the decade, the U.S. experienced consistent population growth, from roughly 313.8 million in 2012 to 338.3 million by 2022. This represents a population growth of around 7.8% over the decade.

Interestingly, while the population grew consistently, the production of construction aggregates didn’t mirror this growth linearly. Aggregate production grew from 2.18 billion tons in 2012 to approximately 2.69 billion tons by 2022, an increase of around 23%. This outsized growth compared to population suggests that there were other significant drivers pushing aggregate demand, beyond just accommodating a growing population.

Key Takeaways

    1. Rapid Infrastructure Development: The higher growth rate of aggregate production compared to population indicates increased infrastructure and construction projects over the past decade. This could be attributed to factors such as urban expansion, redevelopment projects, or large-scale infrastructure initiatives.


    1. Economic Strength: The consistent rise in aggregate demand hints at a robust economy. Construction activities often reflect economic health, as more projects are initiated during prosperous times.


    1. Yearly Variations: While the overall trend was upward, there were certain years, like 2020 to 2021, where the consumption rate jumped significantly. Conversely, 2021 to 2022 saw a slight dip. These variations might correspond to specific events or economic conditions during those years.


    1. Future Projections: With the trajectory pointing upwards and considering the renewed focus on infrastructure and urban development, it’s plausible that the demand for construction aggregates will remain strong. However, it’s crucial to monitor external factors such as economic policies, technological advancements in construction, and environmental considerations, which might influence these trends.

In Conclusion

The past decade’s data unfurls a narrative of an America continuously evolving, where the demand for construction aggregates speaks volumes of its developmental pursuits. Navigating these trends is paramount for businesses seeking to thrive in the construction and aggregate sectors. This is precisely where Mineralocity Aggregates steps in as your guiding compass. We’re not just passive observers; we actively track these trends and integrate the freshest insights into every platform update. With over 800 labor hours devoted to curating and refining data for every update, our commitment ensures you’re always a step ahead, equipped with the most accurate and comprehensive insights. Dive into Mineralocity Aggregates and let us empower your next strategic move in this dynamic landscape.