In the realm of construction, aggregates stand as a cornerstone material. For the U.S., understanding consumption trends of these aggregates on a per-capita basis offers key insights into the construction industry’s health, the evolution of urbanization, infrastructure development, and the nation’s overall economic momentum.
A Rising Demand
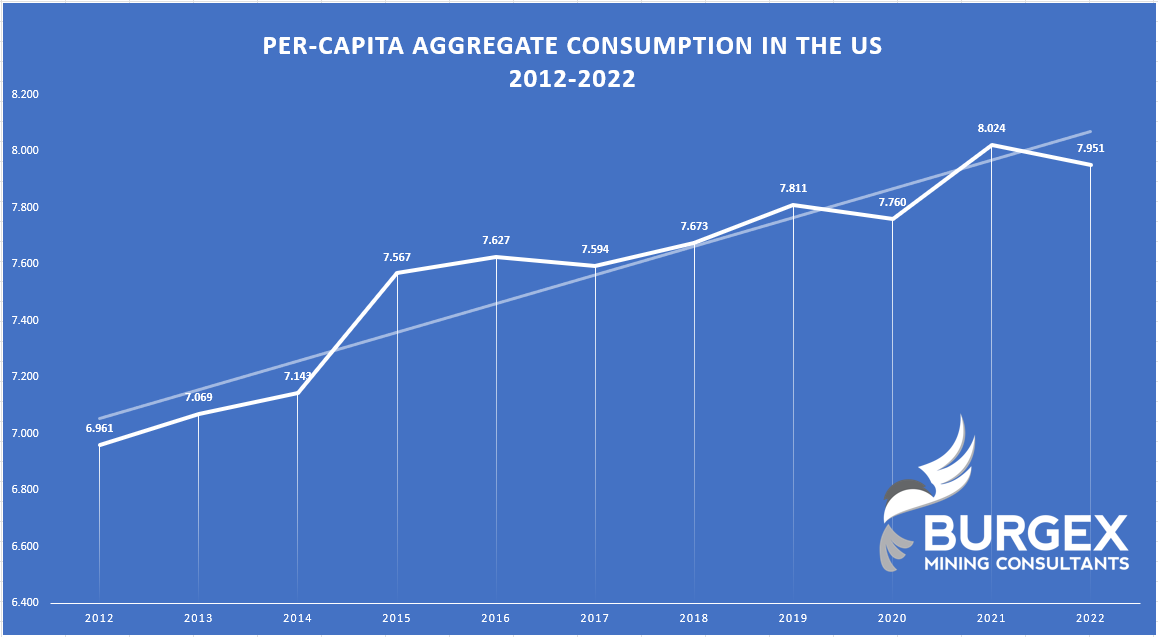
From the data provided by the USGS and US Census Bureau, spanning 2012 to 2022, there’s a distinct upward trajectory in the per-capita consumption of construction aggregates. Starting at a consumption of 6.961 tons per person in 2012, the decade saw a peak of 8.024 tons by 2021. While the average per-capita consumption over this period was 7.56 tons, the growth trend is clear, representing an increase of roughly 15% from 2012 to 2021.
Population vs. Production
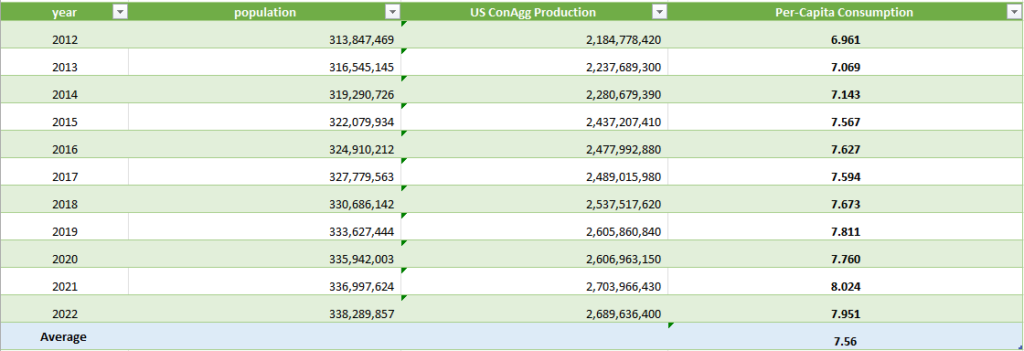
Throughout the decade, the U.S. experienced consistent population growth, from roughly 313.8 million in 2012 to 338.3 million by 2022. This represents a population growth of around 7.8% over the decade.
Interestingly, while the population grew consistently, the production of construction aggregates didn’t mirror this growth linearly. Aggregate production grew from 2.18 billion tons in 2012 to approximately 2.69 billion tons by 2022, an increase of around 23%. This outsized growth compared to population suggests that there were other significant drivers pushing aggregate demand, beyond just accommodating a growing population.
Key Takeaways
- Rapid Infrastructure Development: The higher growth rate of aggregate production compared to population indicates increased infrastructure and construction projects over the past decade. This could be attributed to factors such as urban expansion, redevelopment projects, or large-scale infrastructure initiatives.
- Economic Strength: The consistent rise in aggregate demand hints at a robust economy. Construction activities often reflect economic health, as more projects are initiated during prosperous times.
- Yearly Variations: While the overall trend was upward, there were certain years, like 2020 to 2021, where the consumption rate jumped significantly. Conversely, 2021 to 2022 saw a slight dip. These variations might correspond to specific events or economic conditions during those years.
- Future Projections: With the trajectory pointing upwards and considering the renewed focus on infrastructure and urban development, it’s plausible that the demand for construction aggregates will remain strong. However, it’s crucial to monitor external factors such as economic policies, technological advancements in construction, and environmental considerations, which might influence these trends.
In Conclusion
The past decade’s data unfurls a narrative of an America continuously evolving, where the demand for construction aggregates speaks volumes of its developmental pursuits. Navigating these trends is paramount for businesses seeking to thrive in the construction and aggregate sectors. This is precisely where Mineralocity Aggregates steps in as your guiding compass. We’re not just passive observers; we actively track these trends and integrate the freshest insights into every platform update. With over 800 labor hours devoted to curating and refining data for every update, our commitment ensures you’re always a step ahead, equipped with the most accurate and comprehensive insights. Dive into Mineralocity Aggregates and let us empower your next strategic move in this dynamic landscape.