We’ve been doing a lot of thinking lately about utility—specifically, what makes this platform useful to different parts of the industry.
Contact Us Today

We’ve been doing a lot of thinking lately about utility—specifically, what makes this platform useful to different parts of the industry.

We’re excited to announce a major renovation of the Mineralocity platform, based directly on your feedback. We are adding powerful new data, more intuitive features, and new ways for your team to collaborate.

Since the very beginning, Burgex has helped shape AggNexus with one goal in mind: creating meaningful, impactful conversations in the aggregates and concrete space.
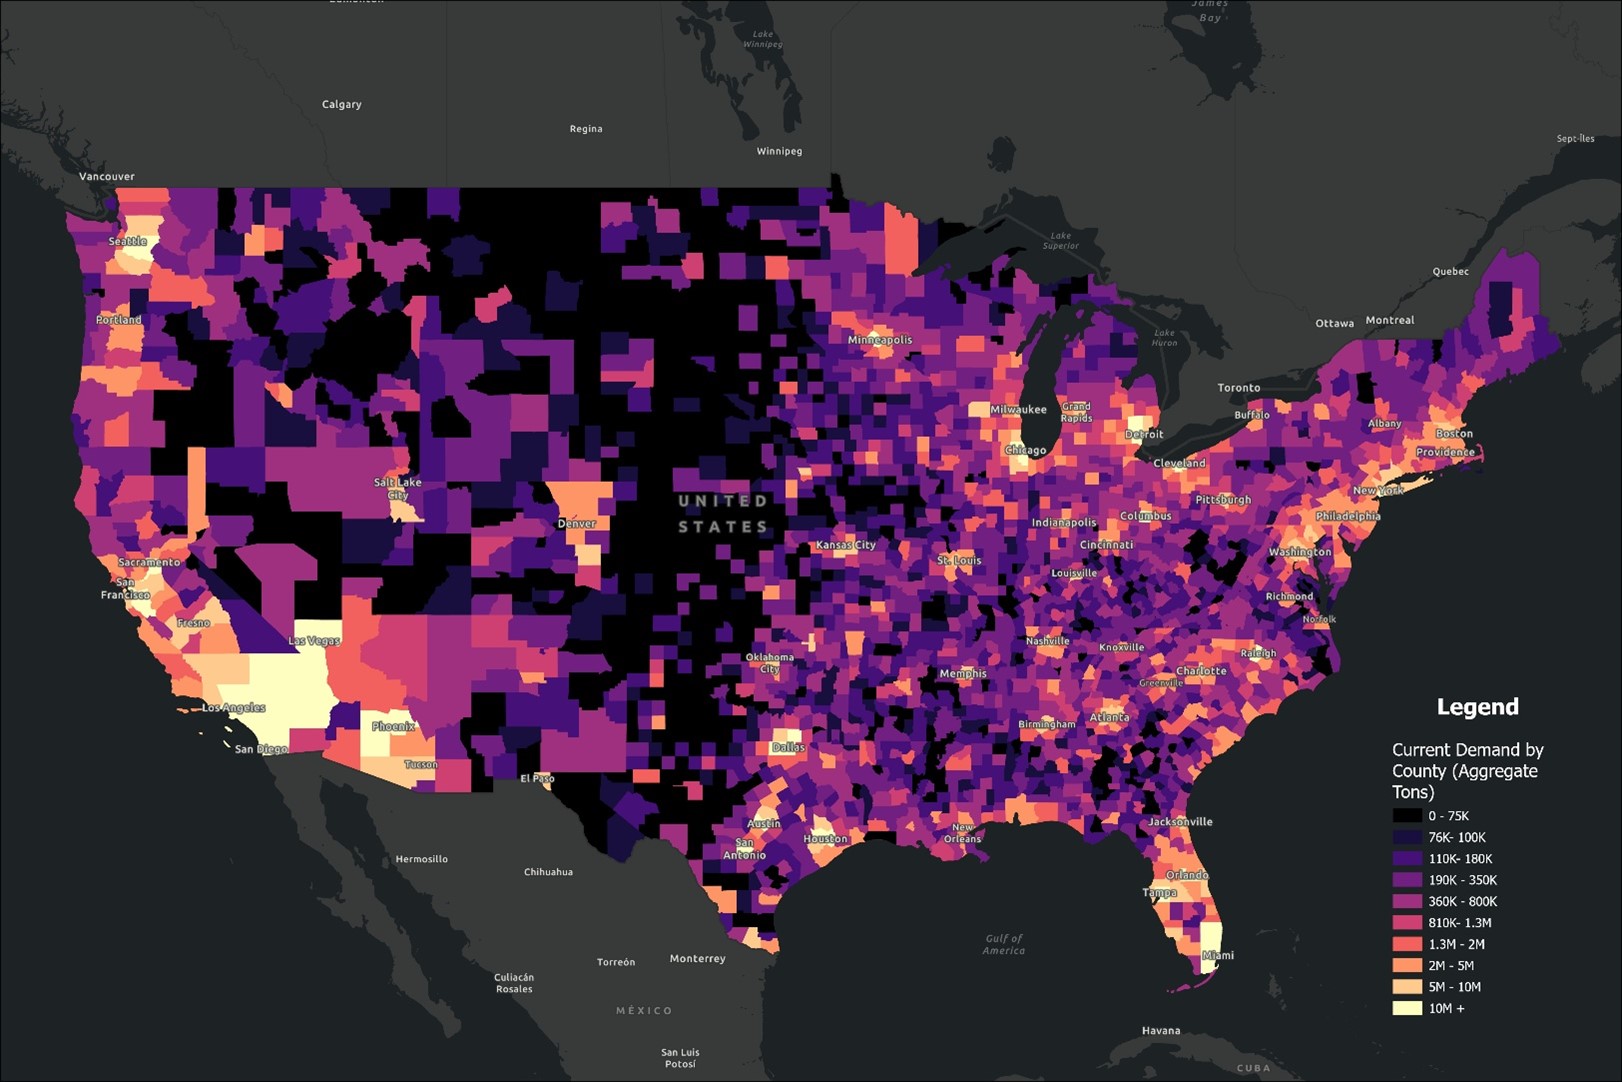
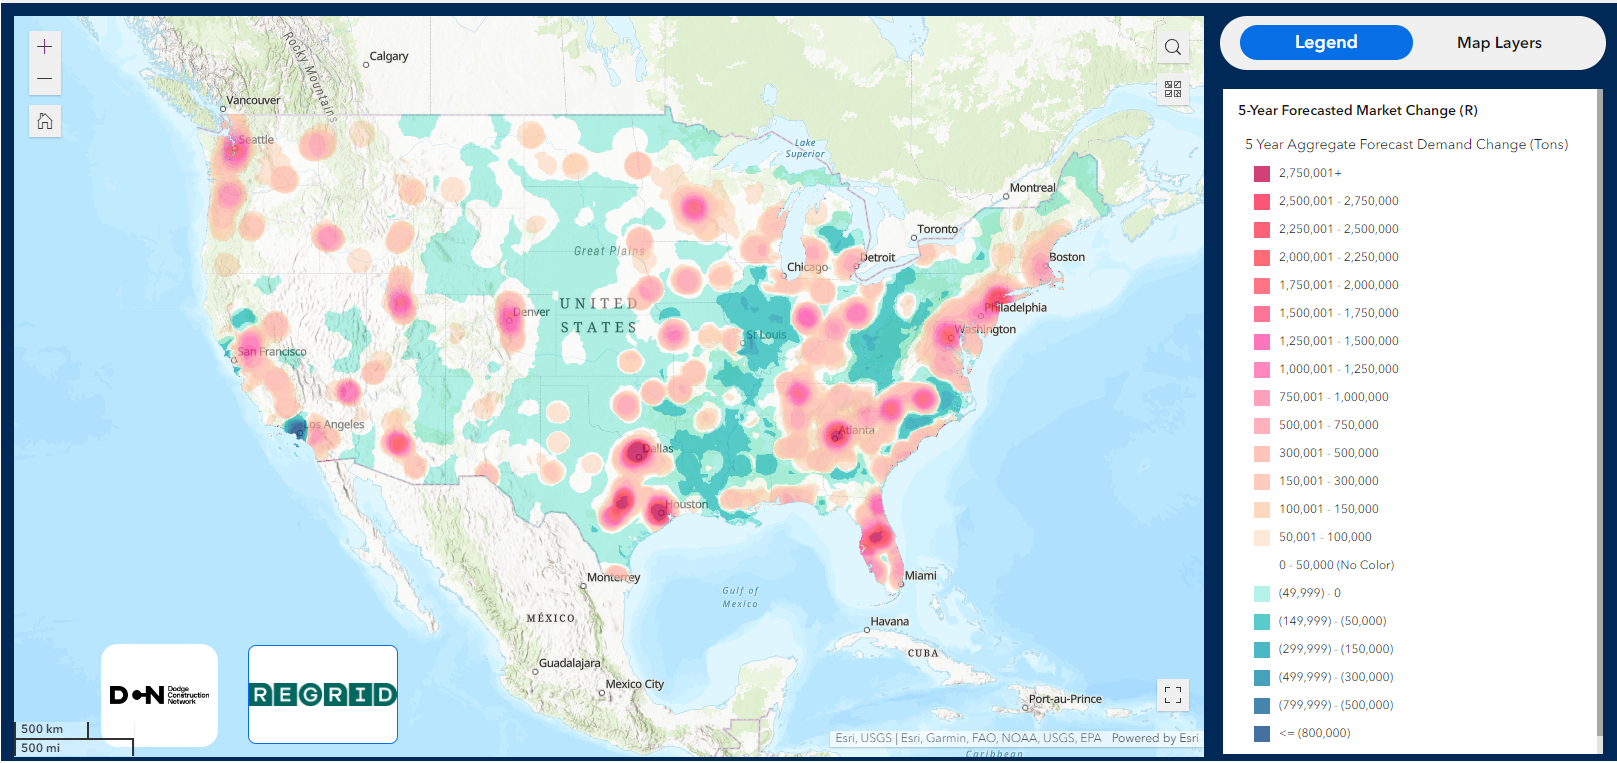
Explore the top 25 U.S. counties by estimated aggregate demand in 2024. Learn how construction trends, infrastructure investments, and population growth are driving demand for aggregates across key regions.
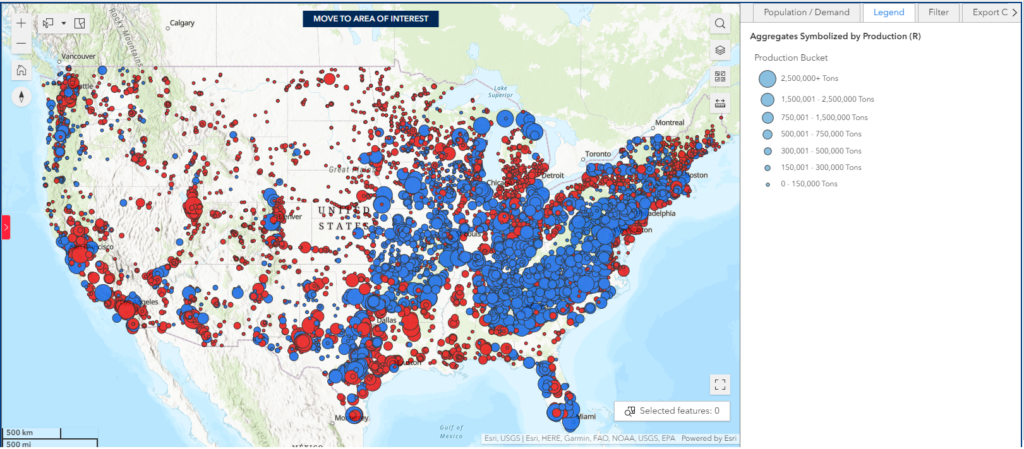
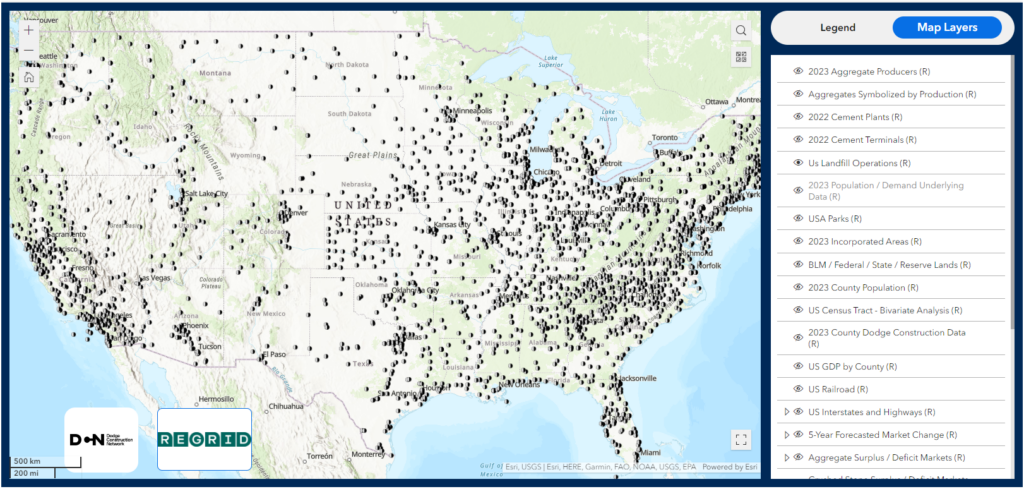
At Mineralocity, we believe that data-driven insights are just the beginning. Our platform provides you with the tools you need to start your research and make smarter decisions, but we’re here to take it further. Whether you’re exploring market trends, identifying mining opportunities, or visualizing geological data, Mineralocity is just the start of your discovery process.

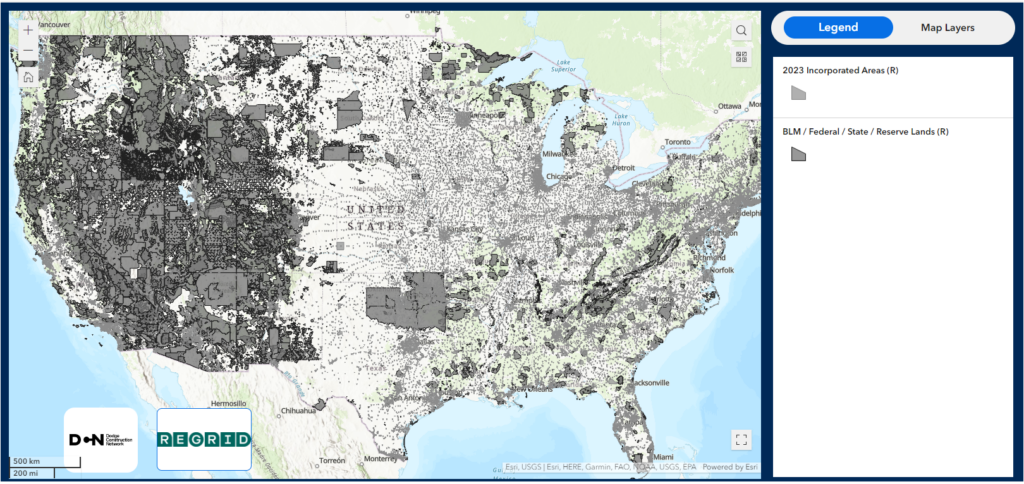
As we continue to develop and refine the Mineralocity platform, we’re excited to share the powerful capabilities it offers for both greenfield exploration and high-level market research. Whether you’re looking to gain insight into a new area for mineral discovery or analyze broader market trends, Mineralocity is the tool to help you make data-driven decisions with ease.
As we move forward into another successful quarter, we want to take a moment to reflect on the value we’re committed to providing. At Burgex, we see our relationship with you as more than just service—it’s about sharing knowledge, insights, and resources that empower your success.
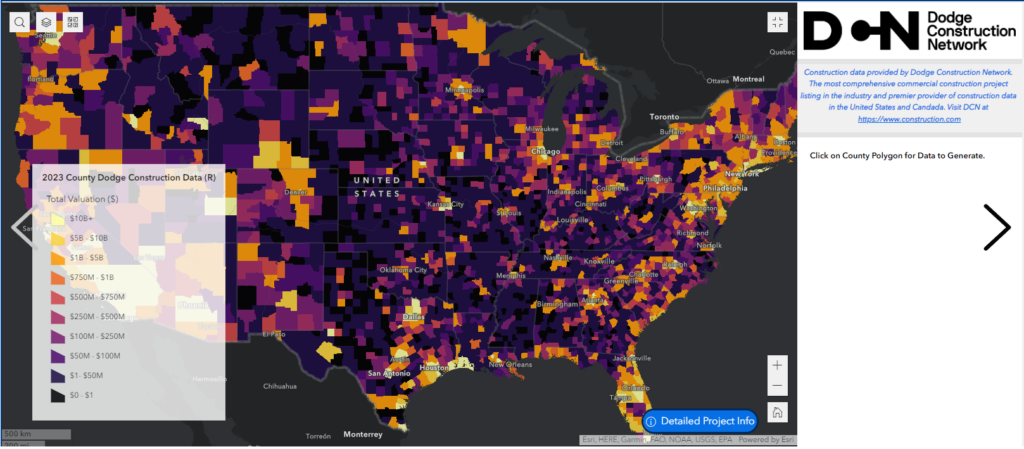
Using Data To Make Better Decisions