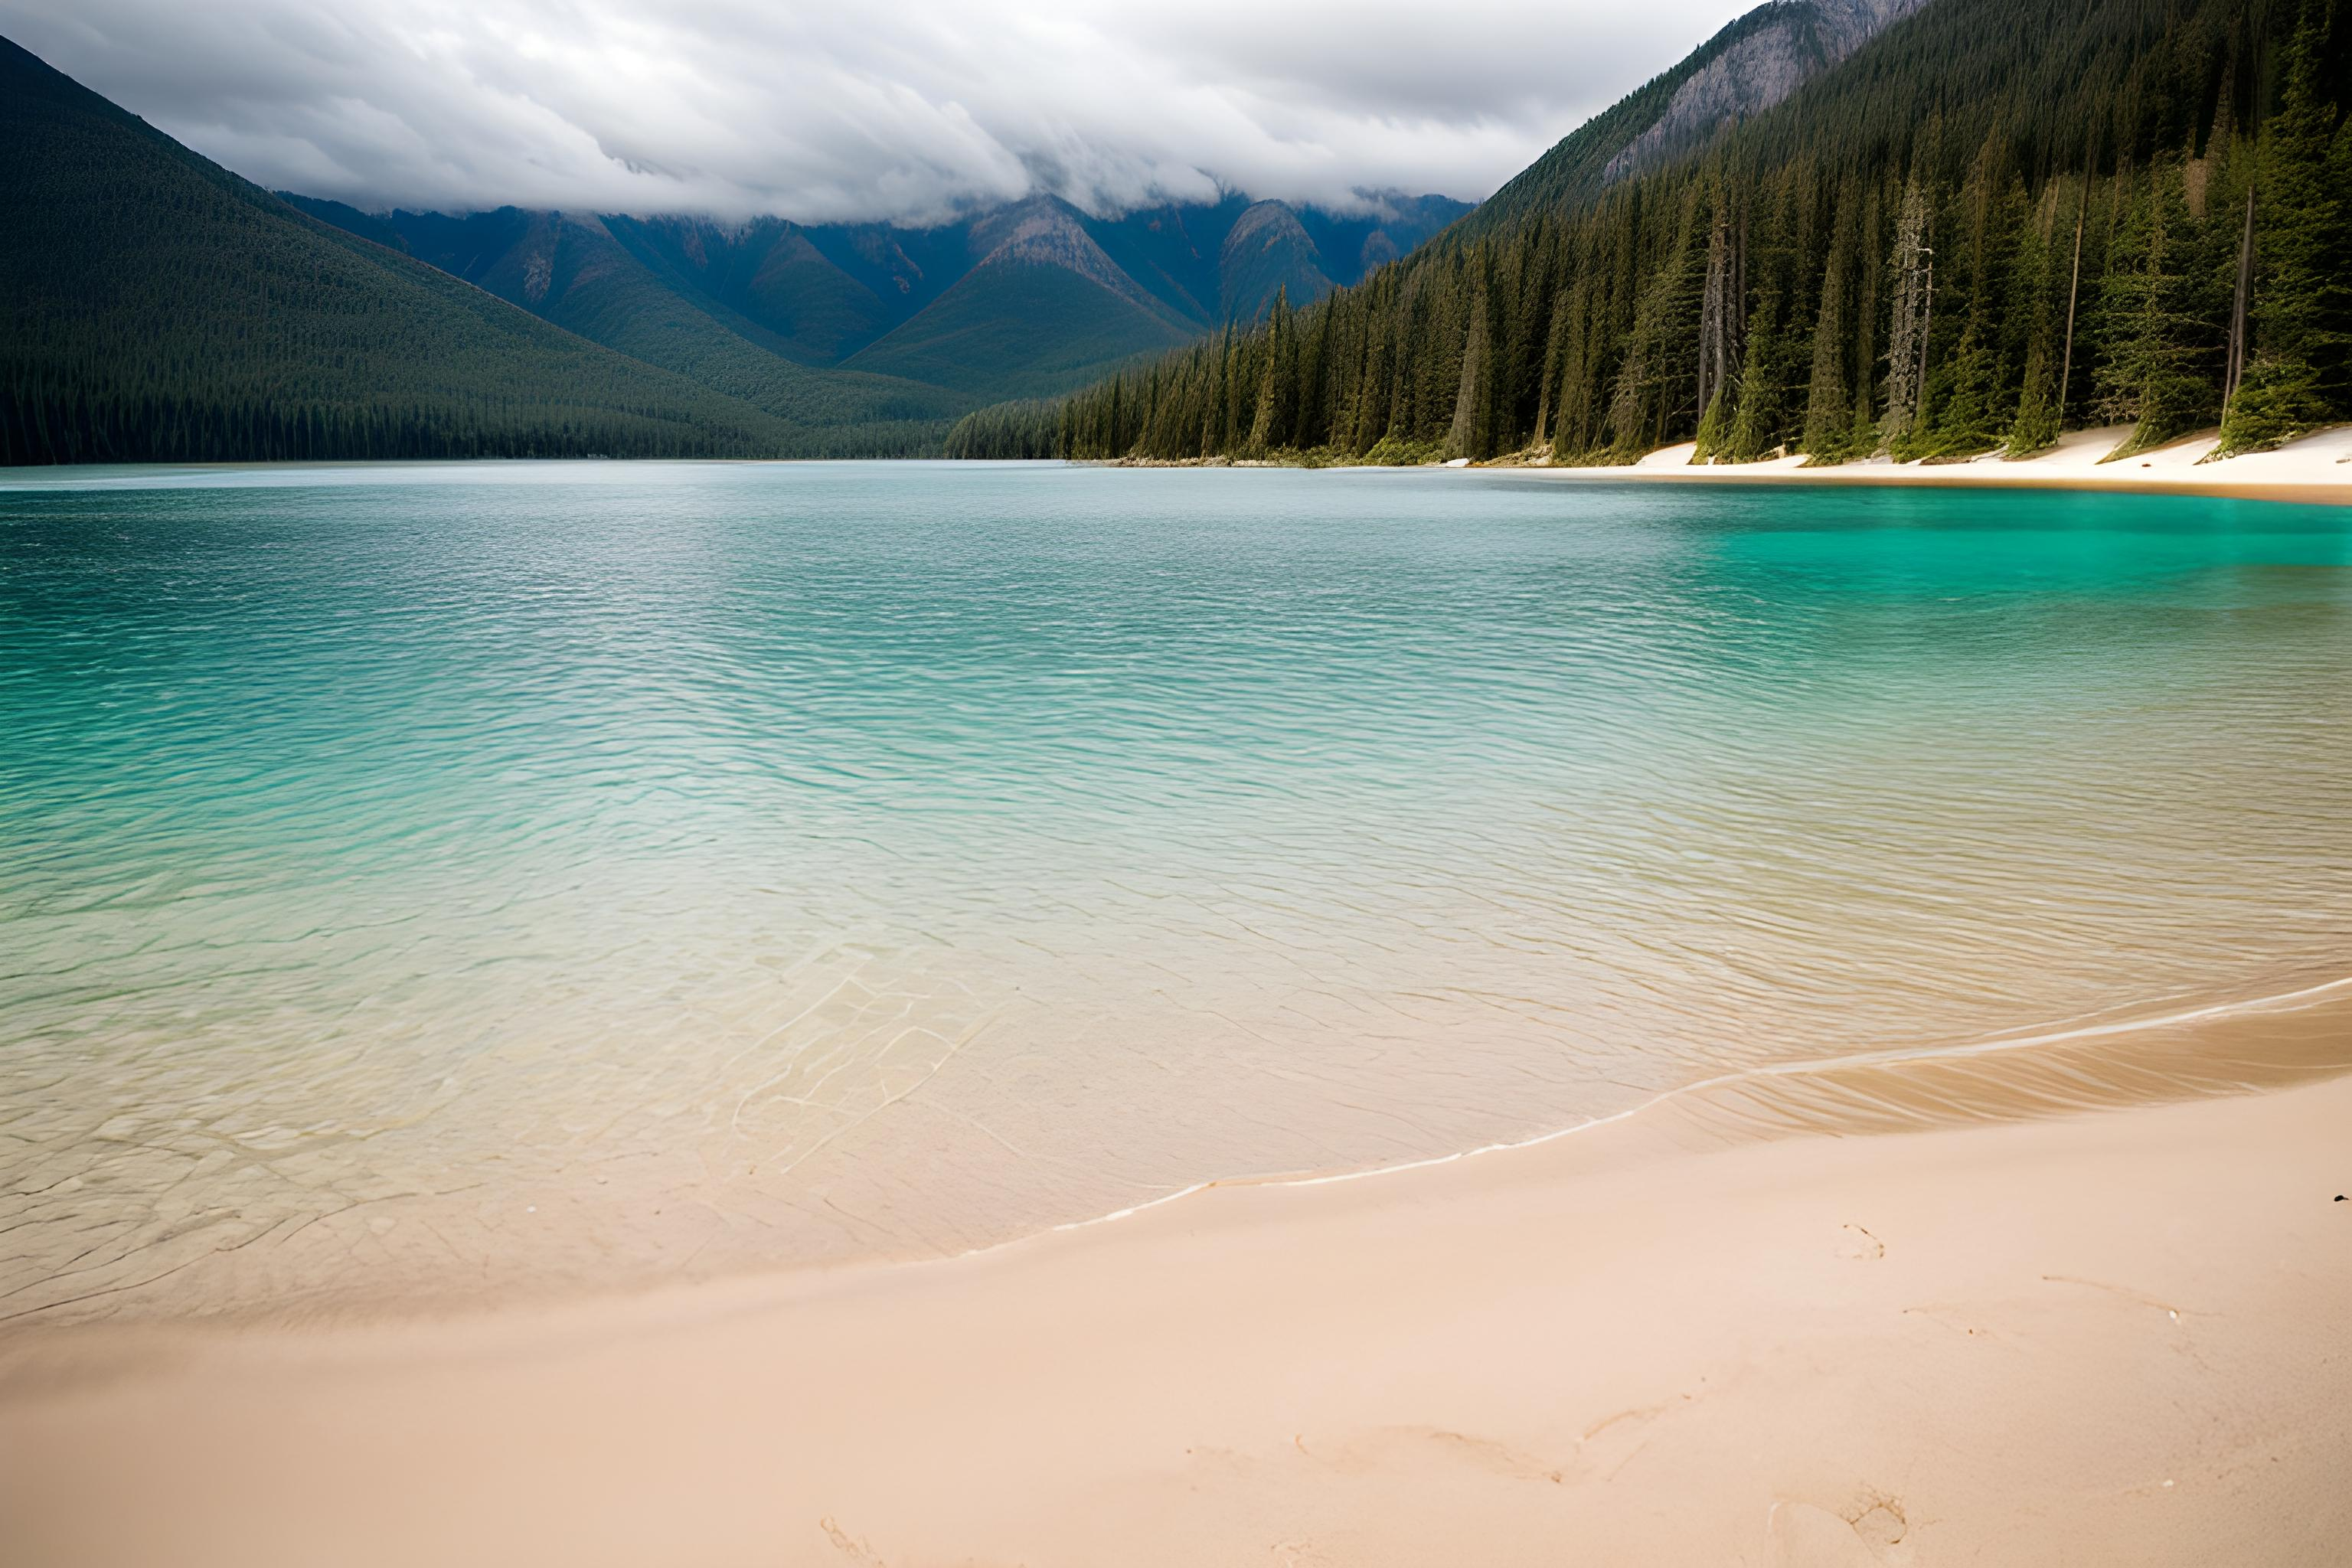
Hello, it’s Stuart Burgess here. Today, I traded my office chair for the sandy shoreline of a picturesque lake where I had the delightful opportunity to enjoy one of my favorite summertime hobbies – fishing. As I stood on the fine sandy surface, basking in the serene environment and reeling in a particularly feisty trout, a thought occurred to me: the debate surrounding the impending “sand shortage”. This brought me back to reality from the tranquility of my fishing spot, and I felt the urge to shed some light on this matter.
For a few years now, the media has been awash with headlines predicting doom and gloom over an imminent shortage of construction sand. Many articles have presented this as an insurmountable challenge, almost as if the sand beneath our feet is vanishing before our eyes. It’s crucial, however, to separate the wheat from the chaff and examine the situation from a pragmatic perspective.
Let’s be clear; we are not running out of sand in the literal sense. Our planet has an abundance of it, and the amount of available sand in the world isn’t diminishing to the point of extinction. However, we are witnessing a scenario where the accessibility and affordability of construction-grade sand are becoming increasingly challenging.
One of the main issues lies in the economics of transporting sand. It’s heavy and bulky, making transportation a significant part of the total cost. As construction sites become farther from their sand sources, transportation costs rise, and so does the total cost of sand. This is the crux of the matter: it’s not that we’re running out of sand; it’s that it’s getting more expensive to bring it to where we need it.
There’s also the issue of construction standards. Not just any sand can be used for construction purposes; it must meet specific criteria. This is another factor that’s contributing to the perceived shortage. As we use up the readily accessible sources of this ‘good’ sand, we’re left with sources that are either less suitable or more costly to use.
This is where manufactured sand comes in. It’s an alternative that can be produced to meet the required standards, offering a potential solution to the problem. However, it’s important to note that manufactured sand is generally more expensive than natural sand due to the production process, adding another layer of complexity to the issue.
But here’s where I’d like to leave you with a glimmer of optimism. This situation is not a death knell for the industry but rather an invitation for innovation and adaptation. It presents a window of opportunity for those ready to think outside the box.
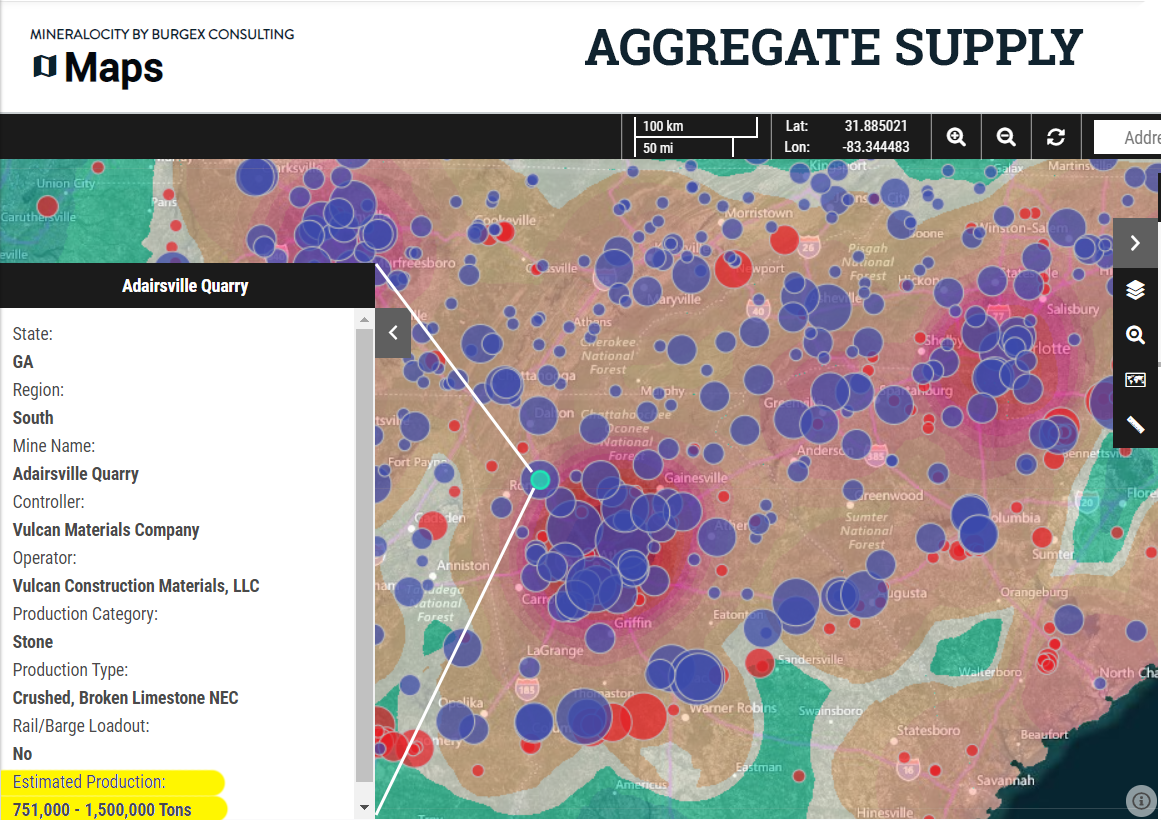
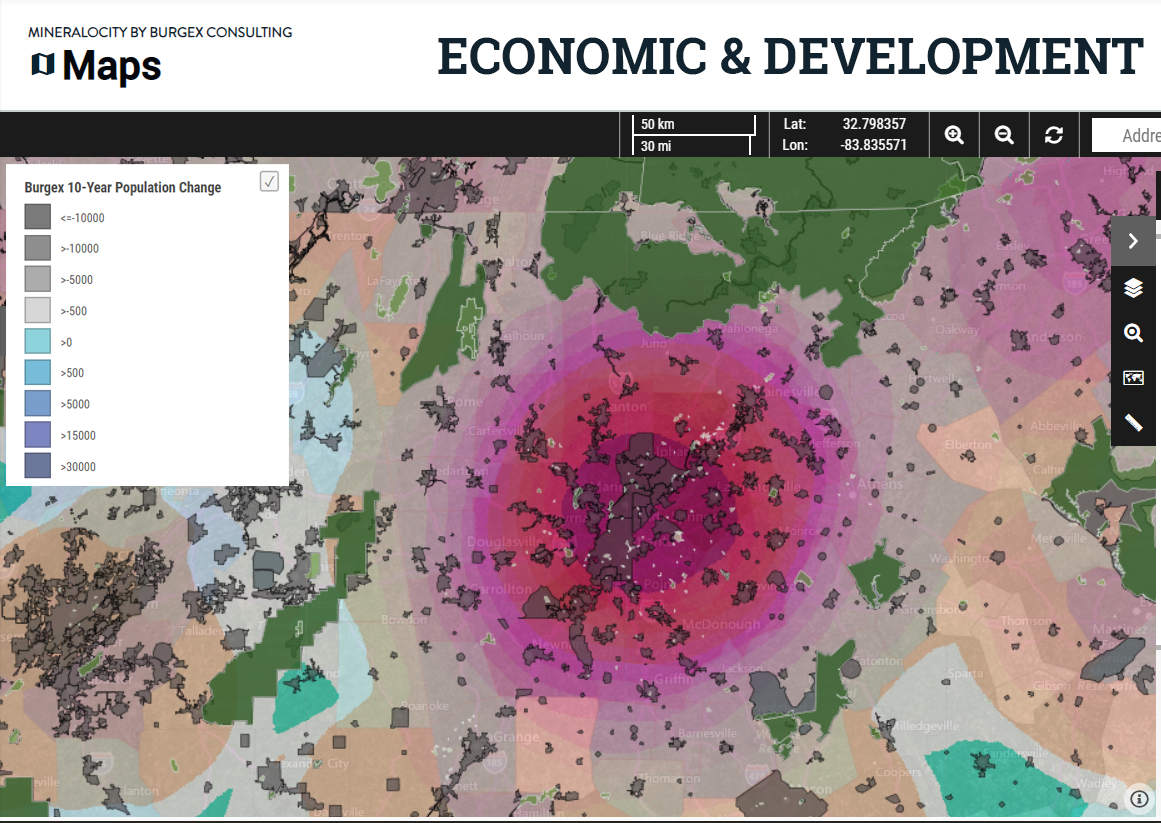
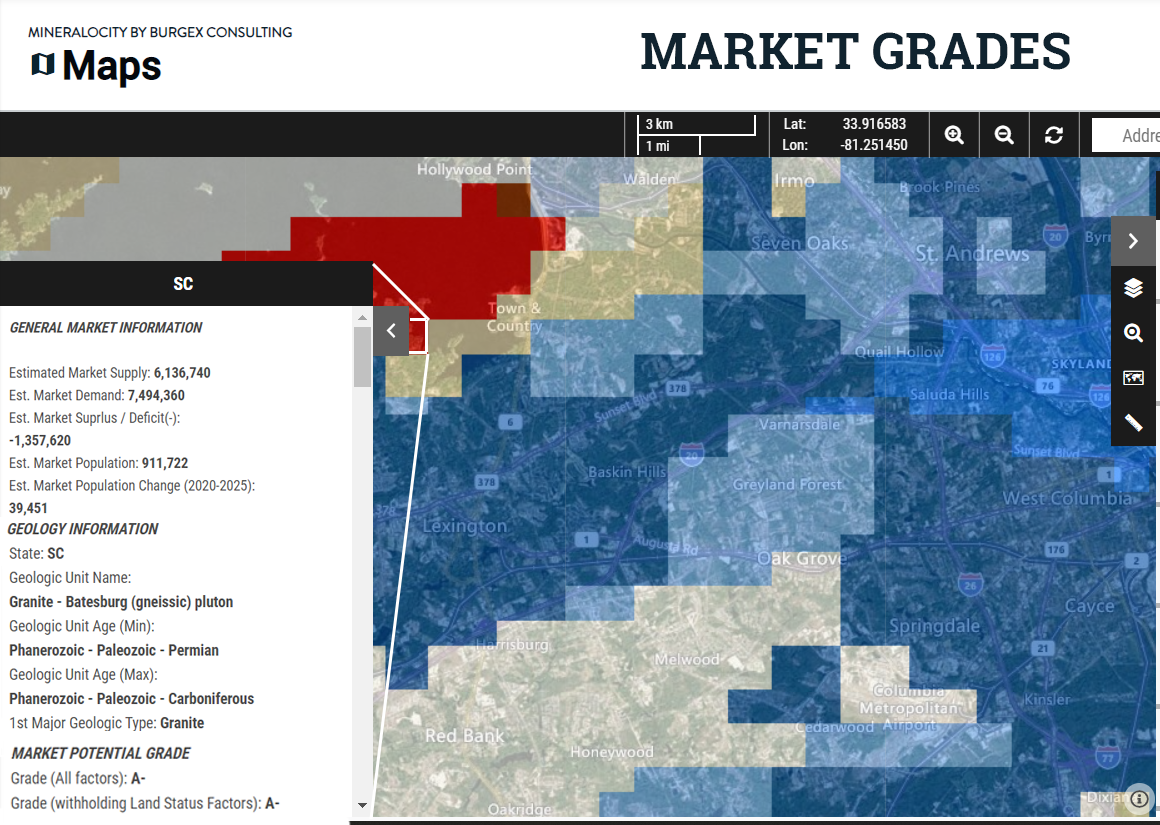
At Burgex Mining Consultants and Mineralocity Aggregates, we believe that there are ample opportunities to open new construction sand producing operations. With creativity, perseverance, and the right tools, these challenges can be turned into prospects for growth. In fact, each update of the Mineralocity Aggregates platform incorporates the latest trends and data relevant to this issue, backed by over 800 hours of labor dedicated to ensuring the most reliable information.
Alarmist views of a sand shortage are useful in that they bring attention to a genuine issue. But they need to be taken with a grain of… well, sand. The reality is not that we’re running out of sand, but that we need to be smarter about how we source, use, and transport it. So next time you’re standing on a sandy beach, remember: The opportunities are as abundant as the grains beneath your feet.
Unlock exclusive, groundbreaking market data with the 2022 Top Aggregate Producers Report. Don't miss out!
Gain a competitive edge with our 2022 Top Aggregate Producers Report! Get exclusive market share data on top producers in each U.S. state with market trends to strategize effectively. A must-have for every industry player!