03 Feb, 26

Why New Suppliers Get Lost (And How to Navigate It)

We attend about 20 trade shows per year, including local regional reverse expos. It’s a great chance for us to meet new people, talk with the ones we know, and get a feel for the sentiment around the industry. It’s an investment, but always worth the time and effort it takes.

What we’ve been seeing across all the shows we attend is the sheer amount of new suppliers popping up that have not serviced the mining/quarry industry before. These folks are wide-eyed and bushy-tailed, walking the halls and absorbing as much information as they possibly can.

You can see the look in their eyes as they realize there is this massive sector they didn’t know about with thousands of new customers they never realized existed. The amount of new customers seems limitless! And overwhelming.

Just how are you supposed to get in front of all these companies to sell your product? What product do you even start with? If you’re selling logistics services, the small mom-and-pop operations are probably not your ideal clientele.

The Problem Isn’t Just for Newcomers

It’s not just the new guys who struggle with this. Even industry veterans know the pain of “driving for dollars”—spending days hunting for a quarry that closed three years ago or trying to navigate a phone tree just to get past the gatekeeper at the weigh scale.

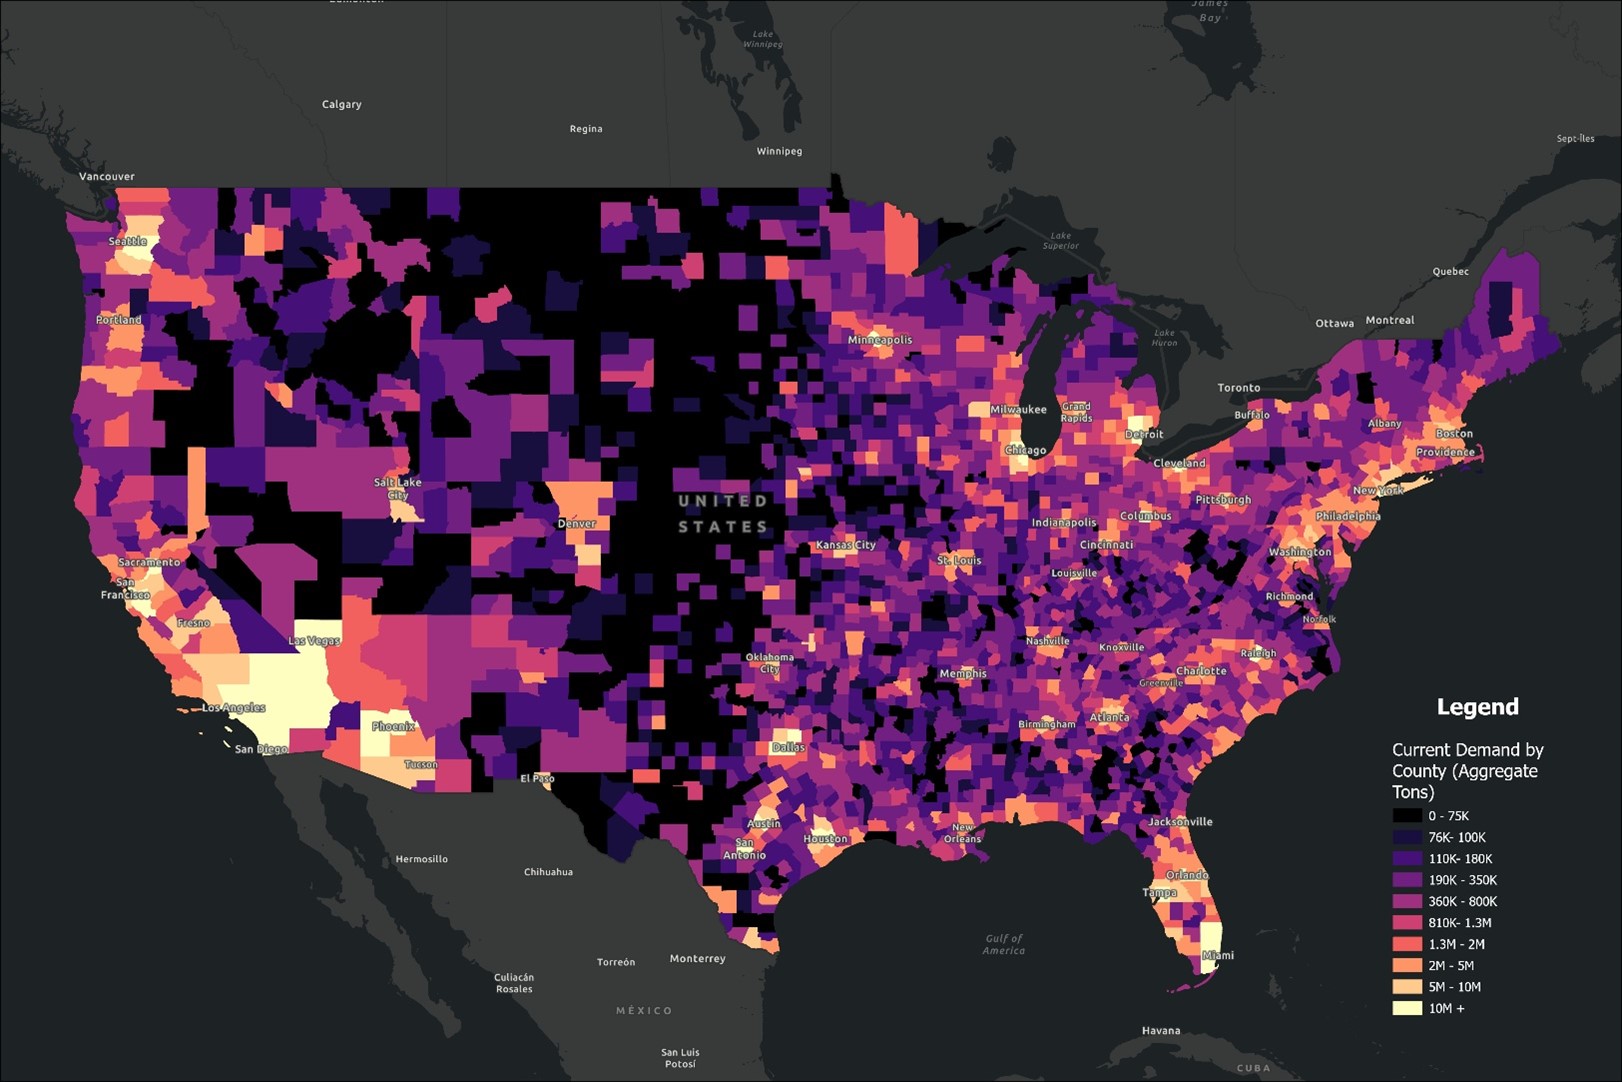
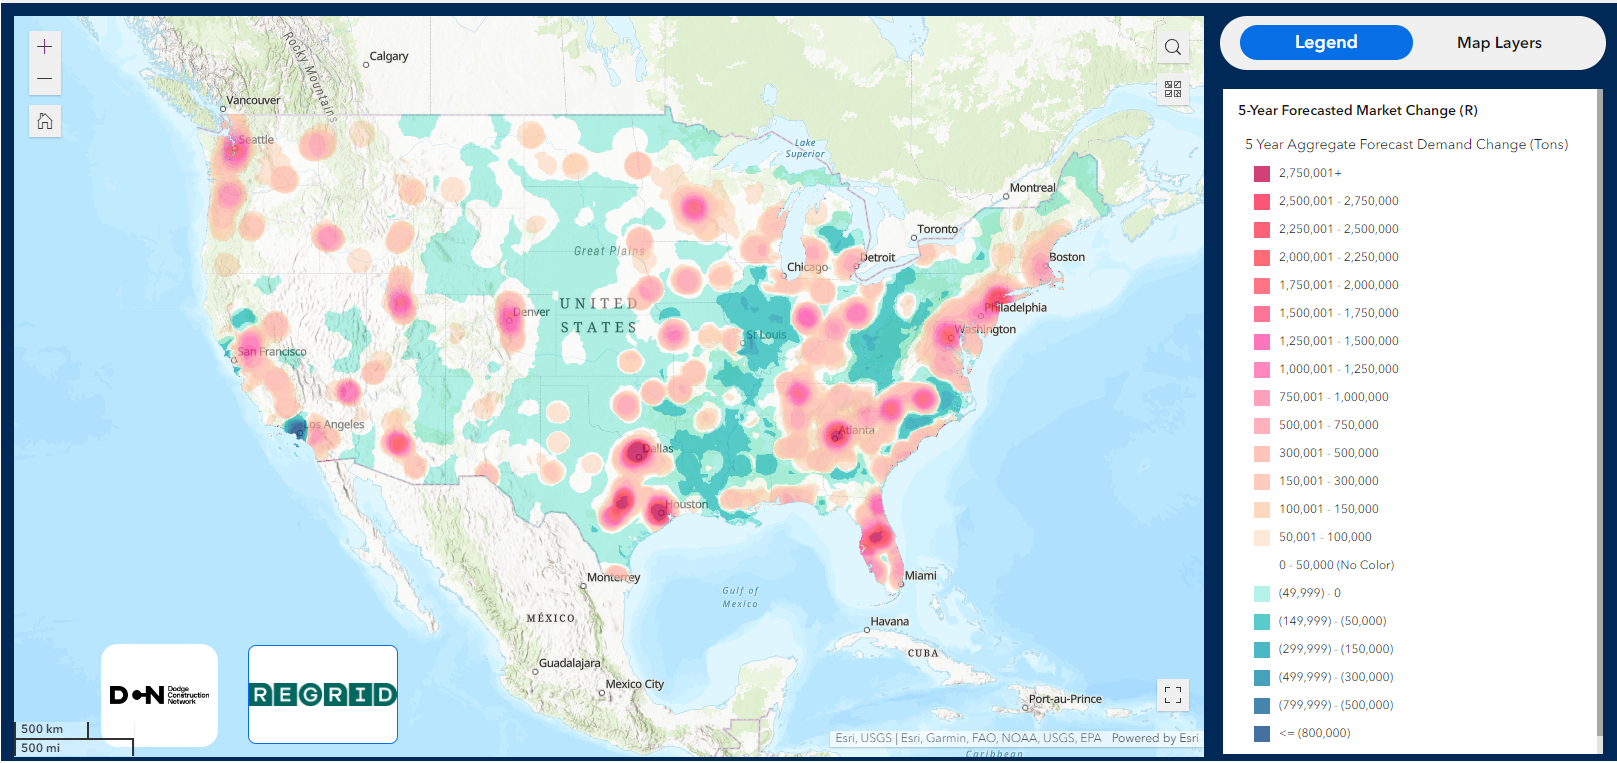
What if you had all of the active operators in the US at your fingertips? What if you could sort by commodity or production estimates, so you only had info on the companies that fit your specific business model?

Well, we have a surprise for you.

We have officially launched the REACH engine within the Mineralocity platform. Designed specifically for suppliers, REACH allows you to filter the entire U.S. market by location, commodity, and production size instantly.

But we didn’t stop at just showing you where they are.

Introducing Verified Contact Information We are now rolling out verified decision-maker contact info directly on the platform. We are starting with Utah and rolling out to the rest of the USA by mid-year.

No more guessing. No more driving to dead ends.

  • New to the industry? Build a qualified prospect list in minutes.
  • Industry Veteran? Stop wasting time on bad data and focus on closing deals.

Mineralocity turns that “overwhelming” market into a searchable, actionable pipeline.

Don’t just see the market—REACH it.

01 Apr, 25

Mineralocity April Newsletter 2025

As we continue to develop and refine the Mineralocity platform, we’re excited to share the powerful capabilities it offers for both greenfield exploration and high-level market research. Whether you’re looking to gain insight into a new area for mineral discovery or analyze broader market trends, Mineralocity is the tool to help you make data-driven decisions with ease.

14 Sep, 23

Mapping the Future: 5 Must-See Maps from Mineralocity Aggregates

Maps aren’t just about geographical locations; they can tell stories, reveal trends, and even predict the future. In the construction aggregate industry, understanding these layers of information can be the difference between growth and stagnation. In this article, we showcase five incredibly revealing maps from Mineralocity Aggregates that every industry player should examine.

1. The Demand Heatmap: A Glimpse into Future Needs

Map showing anticipated future construction aggregate demand change within the United States.
This map shows estimated demand change for construction aggregates in the United States. This map is interactive on the Mineralocity Aggregates platform.

Brief Description: This map shows estimated market change for construction aggregates over the next five years.

Key Insights: East Texas, Atlanta, Tampa, Denver, Phoenix, Salt Lake, and other regions show major growth and significantly increased demand for construction aggregates. On the flip side, Los Angeles is showing a significant decrease in demand, as is most of Illinois and a significant part of the Appalachians.

Business Applications: Shifting demand creates opportunities to shift existing production to growing markets or consider greenfielding new sites near anticipated high demand. In areas of decreasing demand, operations may need to be scaled back or look to other markets or products to succeed.

2. Environmental Regulations and Zoning: Navigating the Minefield

This map shows incorporated areas and other regions of the United States that may have additional considerations for construction aggregates.
This map shows incorporated, state, federal, tribal, and other lands. This map is interactive on the Mineralocity Aggregates platform.

Brief Description: Every region of the United States has a different regulatory framework and fabric of land ownership. This map illustrates how much of the Western United States is covered by federal, state, and tribal lands. The light gray areas on the map illustrate incorporated areas, which are scattered throughout the country.

Key Insights: While not all gray areas are “off limits”, many will have significant challenges or regulatory hoops that will need to be navigated. Construction aggregate producing operations are found throughout many of these regions, but many may be located in areas that would be difficult, if not impossible, to permit today.

Business Applications: This map is useful for locating potential greenfield sites that are outside of incorporated areas or other places – like national parks or wilderness areas – that may be restrictive for development.

3. Infrastructure Development Tracker: The Pulse of Construction

A map showing planned construction aggregate intensive projects within the United States by county.
A map showing aggregate intensive planned construction projects in the United States by county. These include wide infrastructure, local infrastructure, and non-residential construction. This map is interactive on the Mineralocity Aggregates platform.

Brief Description: What does the map tell us about upcoming infrastructure and construction projects? The areas that are yellow represent the highest amount ($10 billion+) of construction aggregate heavy wide infrastructure, local infrastructure, and non-residential construction projects that are planned. The map is broken down by county. Within the Mineralocity Aggregates application, each of these counties can be explored further to identify the number of projects and anticipated spending for each category.

Key Insights: Much of this information correlates with the findings from our demand heatmap, but there are other areas where major aggregate heavy projects are occurring that don’t directly coincide with growing populations. Emery County, Utah – for example – has over $26.3 billion in planned projects and has only a small rural population.

Business Applications: Portable crushers and other quickly scalable operations can be considered for wide and local infrastructure projects that are in areas that don’t have a large permanent aggregate production base.

4. Competitor Landscape: Know Thy Neighbor

A map showing all producers of crushed stone, sand, and gravel in the United States with relative production sizes.
A map showing relative production sizes for crushed stone, sand, and gravel producing operations in the United States. s in the United States. This map is interactive on the Mineralocity Aggregates platform.

Brief Description: This map shows the relative side of construction aggregate producing operations throughout the United States. Blue circles are crushed stone producing operations (quarries) and red circles produce sand and gravel (pits or dredges).

Key Insights: The size of bubbles generally coincides with major population centers or rail access that ties to major urban centers. The distribution of blue and red circles is dictated by geology. You can see in the Southeastern United States, the curve of the fall line with rock above and coastal plane below with its associated sand and gravel operations. Bonus feature – Mineralocity Aggregates creates an interactive pie-chart that shows the actual market share for major producers within the map view. This is a powerful way to get a quick feel for major regional players when exploring new areas.

Business Applications: How could businesses use this information for their strategic planning? Understanding regional competition is key to discovering how to best strategically be positioned within a new market. Each region of the United States has a unique landscape of producers large and small.

5. Recycling Opportunities: The Green Goldmine

A map of all the landfill sites in the United States
A map of all the landfill locations in the United States. This map is interactive on the Mineralocity Aggregates platform.

Brief Description: This map shows the location of every landfill location throughout the United States. This is where construction waste, ranging from excavation waste to concrete and asphalt goes to be buried and disposed of.

Key Insights: Recycled aggregate and construction waste is increasingly becoming a larger and more important aspect of the overall aggregate industry. While these recycled materials currently only account for a small percentage of overall consumed tonnage, it is likely that it will grow significantly over the next several decades. Early adapters will be positioned best to succeed.

Business Applications: Placing a recycling facility between major projects and landfills could create lucrative opportunities.

Conclusion:

These maps offer a multi-dimensional view of the construction aggregate industry, providing actionable insights for businesses eager to carve out or defend their market share. By leveraging the power of Mineralocity Aggregates’ mapping capabilities, companies can make more informed decisions that lead to sustainable growth.

Ready to dive deeper? Sign up for Mineralocity Aggregates and start exploring these maps and many more for your strategic advantage.

11 Sep, 23

The Future of Aggregate Recycling: A Tour of Calgary Aggregate Recycling Inc.

Last week, the Mineralocity Aggregates team had the distinct pleasure of touring Calgary Aggregate Recycling Inc., in Calgary, Alberta. The occasion was a special open house hosted by CDE, an Irish company at the forefront of traditional aggregate processing and cutting-edge recycling technology. This experience provided invaluable insights into the sustainable future of aggregate processing and recycling. 

CDE: Pioneering a Circular Economy in Aggregate Recycling

Before diving into the tour details, it’s important to understand the role that CDE plays in the aggregate recycling industry. With the motto, “Engineered for a Circular Economy,” CDE is doing more than just pioneering waste recycling; they’re laying the groundwork for a more sustainable future. They specialize in providing wet processing solutions that divert over 20 million tons of waste from landfills annually. Whether it’s construction and demolition waste, contaminated soils, or hydro excavation waste, CDE transforms these materials into valuable construction resources.

What We Saw: The Aggregate Recycling Process

During our tour, we were fortunate enough to see the plant process different types of waste, including excavation and hydro excavation waste. The system, efficient and precise, separates the waste into sorted, washed, and screened streams of rock, sand, and fines.

Sustainability in Action: Closed-Loop Water System

Calgary Aggregates Recycling closed loop water recycling system

A highlight of the plant’s operation was its closed-loop water system, which recycles ~95% of the water used. This feature not only conserves a critical natural resource but also allows the plant to function with a minimal environmental footprint. This allows for faster permitting and a lower impact footprint.

Efficiency: Monitoring from a Single Dashboard

What stood out during the tour was the plant’s commitment to efficiency. Every aspect of the operation can be monitored from a single dashboard, ensuring that each element runs at peak efficiency to maximize uptime. This is a crucial aspect for any plant that aims to be both profitable and sustainable.

Implications for the Future

Rethinking Waste Management

The tour was more than just an educational experience; it was an inspiring vision of the potential that lies ahead. One of the most immediate takeaways was the need to reevaluate our perceptions of waste. Traditionally viewed as something to discard, waste, as demonstrated by Calgary Aggregate Recycling Inc. and CDE, can be a valuable resource.

Scalability and Adaptability

The advanced technologies we observed have significant scalability and adaptability potential. With CDE’s wet processing solutions capable of diverting over 20 million tons of waste from landfills annually, one can only imagine the global impact if more such facilities were to adopt these technologies. And given that these technologies can be adapted to handle various types of waste—from excavation waste to contaminated soils—it opens doors for widespread industry adoption. We were told that CDE can build these plants to handle as little as 70tph to as much as 700tph. They also offer custom solutions that could potentially be even larger.

Economic Benefits

While the environmental implications are obvious, there are also substantial economic benefits to consider. The plant’s closed-loop water system, for example, significantly reduces water costs. The ability to monitor every aspect of the operation from a single dashboard allows for real-time decision-making, reducing downtime and boosting profitability.

Policy and Regulatory Implications

The success of facilities like Calgary Aggregate Recycling Inc. should encourage policymakers to support sustainable practices in the aggregate industry. By doing so, they can facilitate the transition from traditional waste management to circular economic models that are both profitable and beneficial for the planet.

A Forward-Looking Approach

In a world that’s increasingly cognizant of environmental responsibility, adopting the practices showcased during our tour is more than just good business sense—it’s a societal imperative. Companies that are quick to embrace these technologies not only stand to gain a competitive edge but also become leaders in setting new industry standards.

By embedding these forward-thinking practices into our industry’s operations, we not only mitigate our environmental impact but also create a more resilient, cost-effective, and ultimately more sustainable business landscape. The tour reaffirmed our belief that with the right technologies and practices, the aggregate industry has a bright and sustainable future.

Conclusion

Calgary Aggregates Recycling plant built by CDE

The tour of Calgary Aggregate Recycling Inc. was eye-opening, to say the least. It revealed a glimpse of what is possible when innovation meets sustainability. With companies like CDE leading the way, the future of aggregate recycling is not just promising; it’s imperative. And for teams like ours at Mineralocity Aggregates, it affirms our commitment to be part of this sustainable future.