I’ll be candid – I’ve written a lot about Mineralocity Aggregates over the last six months, but I recently found out from an industry colleague that much of what I’ve written is overly technical or doesn’t adequately explain WHAT Mineralocity Aggregates is and how it can be used by those in and around the aggregate industry. This article is my attempt to rectify that, here we go!
All Commercial Aggregate Producers Mapped – Throughout the Entire United States
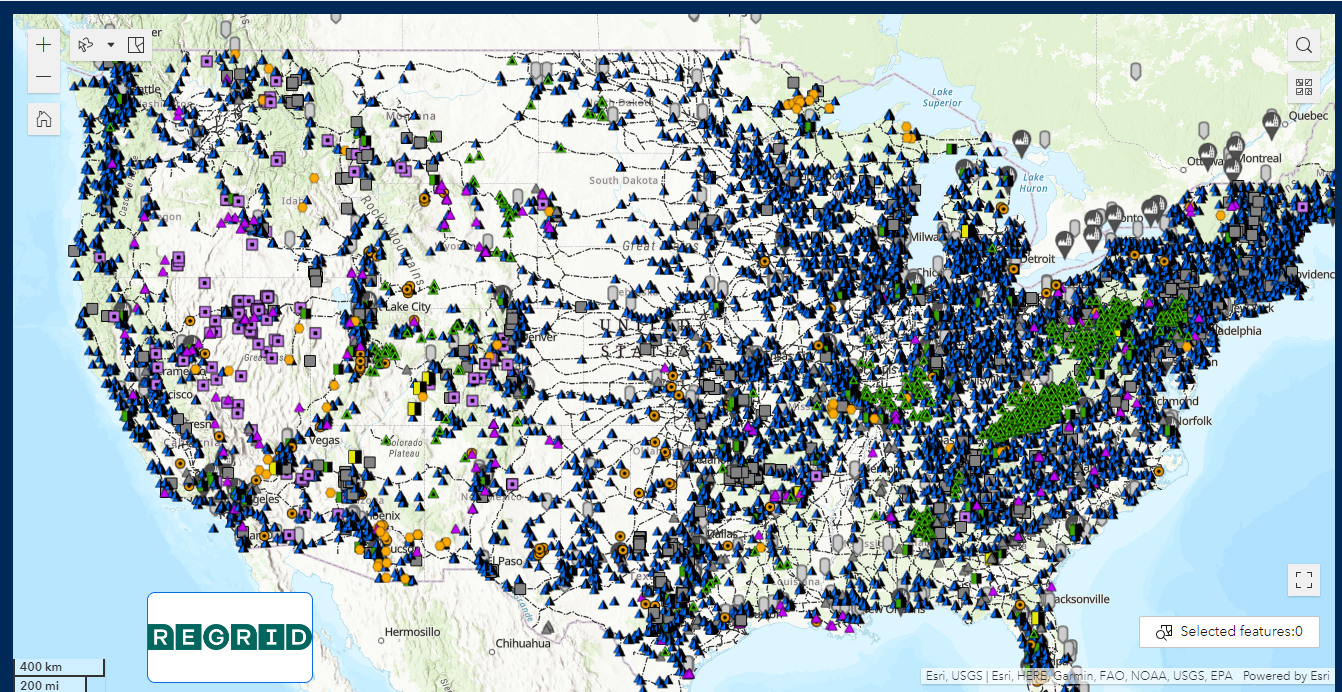
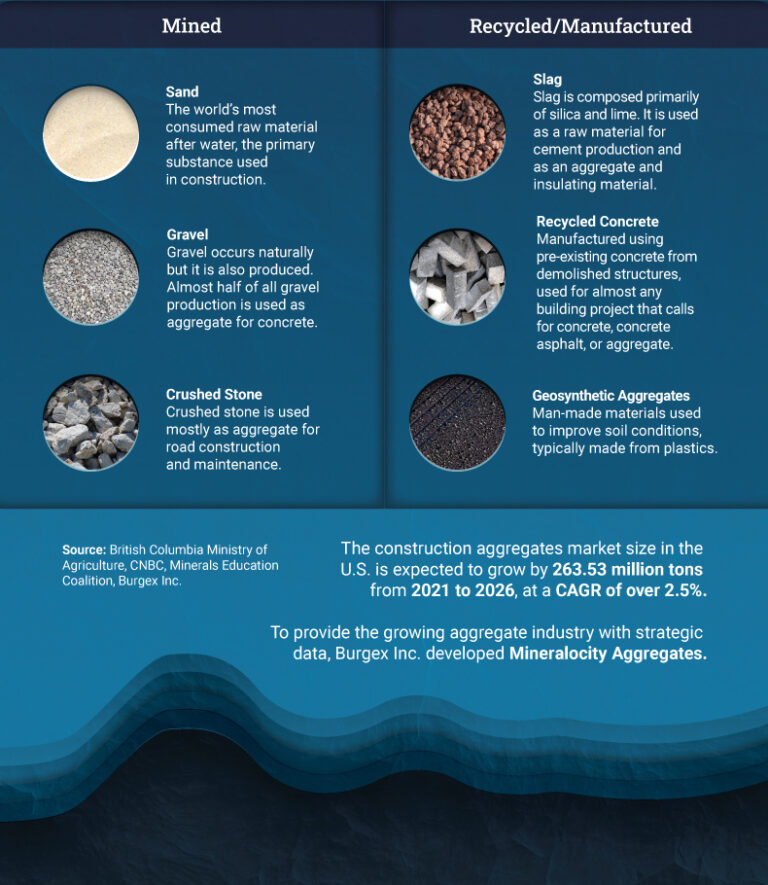
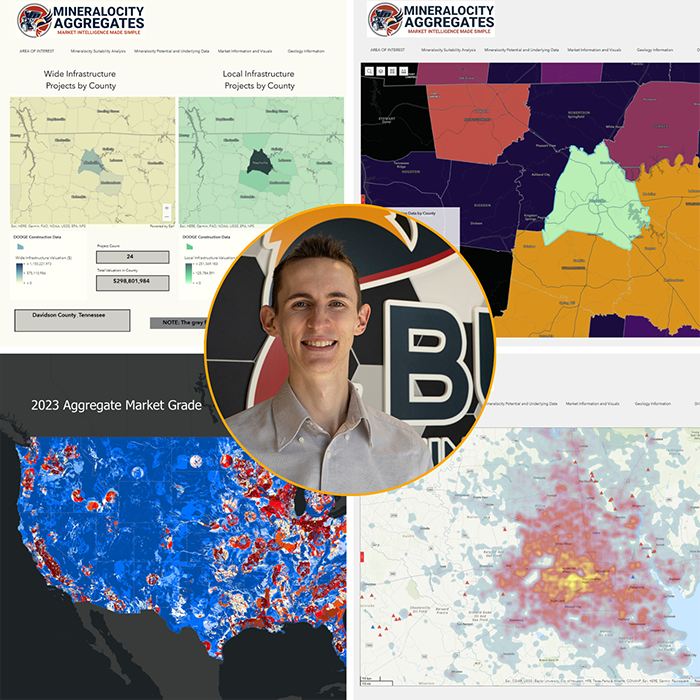
Mineralocity Aggregates has all 7,000+ commercial construction aggregates (sand, gravel, crushed stone) producers mapped out. This information is useful for those who are looking to source coarse or fine aggregate materials (construction contractors), those who are evaluating different markets to expand and start production of construction aggregates (active and potential producers), and others.
Some examples of how these mapped aggregate producers could be used are:
- Locating sources for fine or coarse aggregate materials near a construction site
- Identifying areas where there is a lack of current aggregate production
- Identifying potential customers for suppliers to the aggregate industry – from explosives to tires and even consulting services
Aggregate Demand Estimated and Mapped
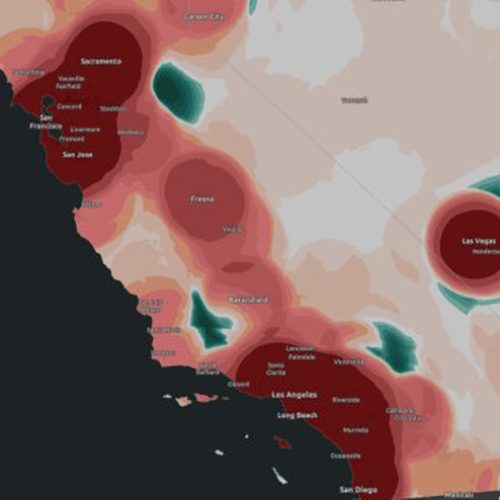
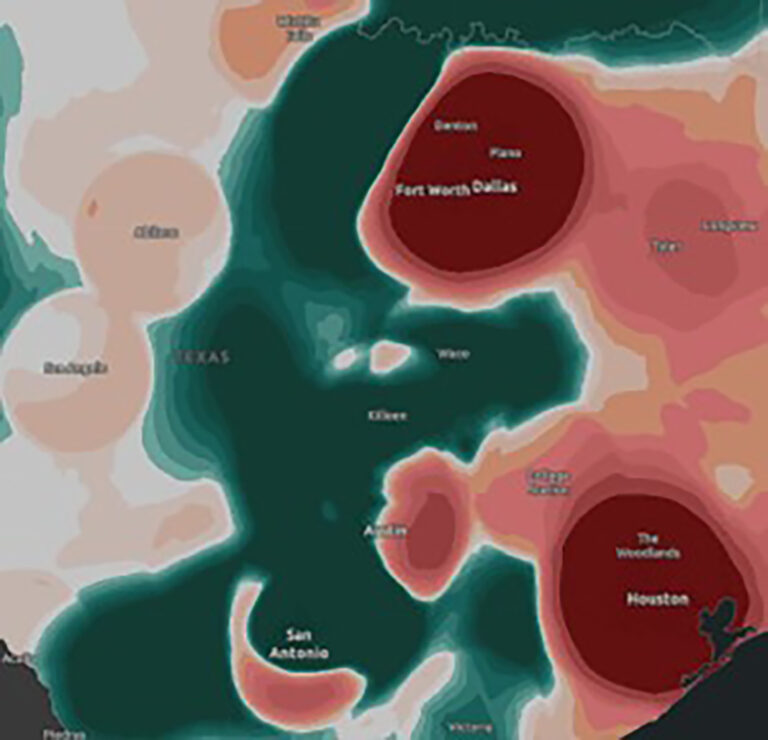
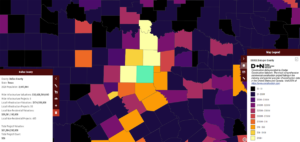
Mineralocity Aggregates contains a very accurate proprietary population model that is used to estimate construction aggregates demand – locally, regionally, and nationwide. This demand can be visualized and explored in a variety of ways within the platform. This is especially useful for current and potential producers who are looking to scale existing or start new operations. This data is also useful for aggregate industry associations, government entities, and others who are seeking to better understand the flow of construction materials.
Some examples of how aggregate demand can be used:
- Locating areas with good potential for starting a new pit or quarry
- Optimizing existing operations to explore new portions of the local market
- Evaluating long term local and regional planning needs
Aggregate Supply Estimated and Mapped
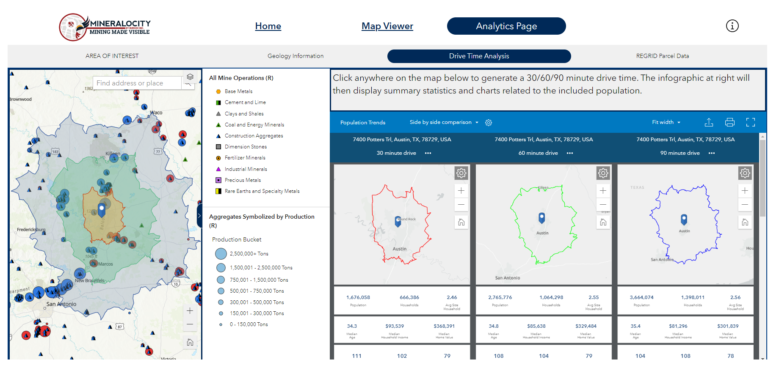
In addition to having construction aggregate demand mapped, the Mineralocity Aggregates platform also contains estimated supply from each of the 7000+ mapped operations and the impact of that supply within the trucking market region. This supply can be explored in a variety of ways, from clicking on each quarry individually to get an estimated production range, to exploring the market of a very specific location to generate an estimated balance of supply and demand.
Some examples of how aggregate supply can be used include:
- Evaluating the performance and market dominance of competitors
- Identifying areas of supply deficit that could support a new quarrying operation
- Identifying and classifying potential customers for suppliers to the aggregates industry
Regional Economic, Development, and Geologic Information
Mineralocity Aggregates contains a variety of economic market intelligence that can be explored and visualized. This information ranges from the mapping of housing permits to growth projections. This information is useful to further explore potential regions that are primed for development of construction aggregates. The platform also contains layers that display general geology and favorable geology for production of fine and coarse aggregates. Some features even include interactive estimated production within specific geologic units – which is very helpful for identifying a good quarry location.
This regional economic information can be used to:
- Explore high growth areas – or areas of future growth that could support quarry development
- Identify areas of potential supply deficit that could warrant scaling an existing operation
- Generating data rich presentations that can be used to present opportunities – for industry associations, to governments, and producers.
Putting it all Together –Market Grades
If you are looking for a quick way to evaluate a specific location and get a snapshot of current and future market conditions, the Market Grades layer is the first one to check. This layer ranks specific locations on a simple A – F scale that factors everything from supply and demand to geology and even things like permitting difficulty and development potential. Clicking on a specific location – down to ½ mile squares – will open up a table that contains a host of useful information on the market, economics, geology, etc.
The Burgex Market Grades can be used to:
- Quickly identify areas that are economically suitable for locating a quarry
- Identify regions that have future opportunities for development
- Explore the technical feasibility of opening a new quarry location
Conclusion
The Mineralocity Aggregates Platform provides market intelligence on the construction aggregates industry that is mapped and can be visualized and interactively explored – think Google Earth specifically designed for the aggregates industry. The tools and datasets available on the platform are constantly growing and more features are being added on a regular basis. Look for exciting new updates soon that further expand its usefulness – check it out for yourself at: https://mineralocity.com/ and you will see that it really is the future of aggregate market intelligence.