25 Aug, 23

Top Aggregate Producing States: Texas and Georgia in 2022

In 2022, as the nation strove for economic recovery and revitalization of infrastructure, the aggregate industry in the United States proved itself more than just a backbone—it emerged as a vital force in national construction efforts. Aggregates, the sand, gravel, and crushed stone used to build the roads, bridges, and buildings we rely on every day, are an unsung hero of American industry. In this context, two states — Texas and Georgia — have demonstrated exceptional prowess as top aggregate producing states, leading the way with staggering production figures, and setting the gold standard for other states to follow. Texas is king, by a long shot, but Georgia (while not in the #2 spot on production) has stood out as a notable and growing producer.

This isn’t just about rocks and numbers. It’s about economic health, job creation, and sustainable development, where meeting today’s demands doesn’t compromise the needs of tomorrow. It’s about the livelihoods of countless individuals whose efforts in these key states reverberate across the nation.

Behind every mile of highway, every modern office building, and every growing community lies the story of aggregates. And in 2022, Texas and Georgia were writing captivating chapters of this story. Here, we dive into the data, explore the leading producers, and uncover the secrets of their success.

Texas: The Lone Star Leads the Nation

In 2022, Texas was the nation’s top aggregate producer, with a staggering total of 315 million tons produced throughout the year. It maintained impressive production figures across all four quarters, despite a 15.7% seasonal decrease in the fourth quarter.

Top Aggregate Producers in Texas (2022)

  • Vulcan Construction Materials: Approximately 29 million tons
  • Martin Marietta Materials: Approximately 28 million tons
  • Heidelberg Cement AG: Approximately 21 million tons

These titans of industry play a critical role in Texas’ substantial output, powering both the state’s infrastructure projects and its economy.

Georgia: The Peach State's Solid Production

Georgia, another leading state in aggregate production, reported a total of nearly 80 million tons in 2022. Unlike other states, Georgia reported growth in three of the four quarters, with a notable 13.5% increase in the third quarter. On production numbers alone there are several other states between Georgia and Texas, but the solid growth of aggregate demand in the peach state tells a compelling story.

Top Aggregate Producers in Georgia (2022)

  • Vulcan Construction Materials: Approximately 32 million tons
  • Martin Marietta Materials: Approximately 11 million tons
  • Imerys S.A.: Approximately 7 million tons

These leading producers significantly contribute to Georgia’s rank as a top aggregate producing state, supporting major construction projects throughout the region.

What Drives These Exceptional Figures?

Several factors contribute to Texas and Georgia’s leading positions in aggregate production:

Abundant Natural Resources: Texas has vast reserves of limestone, while Georgia is rich in granite deposits and has a great supply of high-quality sands across the Coastal Plain.

Strategic Locations: Proximity to major construction markets, such as Houston in Texas and Atlanta in Georgia, plays a pivotal role.

Dominant Industry Players: Companies like Vulcan Construction Materials, Martin Marietta Materials, and CRH PLC operate extensively in these states, bolstering high production figures.

Economic Impact and National Perspective

The scale of production in Texas and Georgia has broader economic implications. In Texas, the aggregate industry generated billions in revenue, a testament to the critical role aggregates play not only in construction but in the economic health of the state itself.

Nationally, the total U.S. aggregate production in 2022 was reported at 2.44 billion metric tons, despite a 7.4% decrease in the fourth quarter. This national figure underscores the significance of top-producing states like Texas and Georgia in the broader U.S. context.

Conclusion

As America’s infrastructure continues to evolve and expand, the demand for aggregates shows no sign of slowing. States like Texas and Georgia, with their robust production figures, exemplify the pivotal role that aggregates play in our nation’s growth. These states, led by prominent producers such as Vulcan Construction Materials, LLC in the South and Martin Marietta Materials, Inc. in the Midwest, have set a remarkable standard.

This growth story is not just about tons of aggregate produced; it’s a narrative of innovation, resilience, and sustainable development—a narrative that will undoubtedly continue to shape America’s future. With dynamic players like CRH PLC in the Northeast and Mid-Atlantic regions, the competitive landscape promises exciting developments ahead.

Where do these trends lead, and what new strategies will industry titans and smaller players alike adopt in response to the changing needs of our growing nation? These questions are vital for anyone involved in or tracking the construction and aggregate industries.

For a deeper dive into the data that paints this compelling picture, Mineralocity Aggregates is your go-to source. With comprehensive, up-to-date information and insightful analysis, Mineralocity Aggregates provides the resources industry professionals need to stay ahead of the curve. From detailed production figures to in-depth profiles on top producers, the data that shaped this article and so much more is readily available for you at Mineralocity Aggregates.

To access the complete list of top aggregate producers in each state and explore more exclusive insights, download our exclusive report from Mineralocity Aggregates.
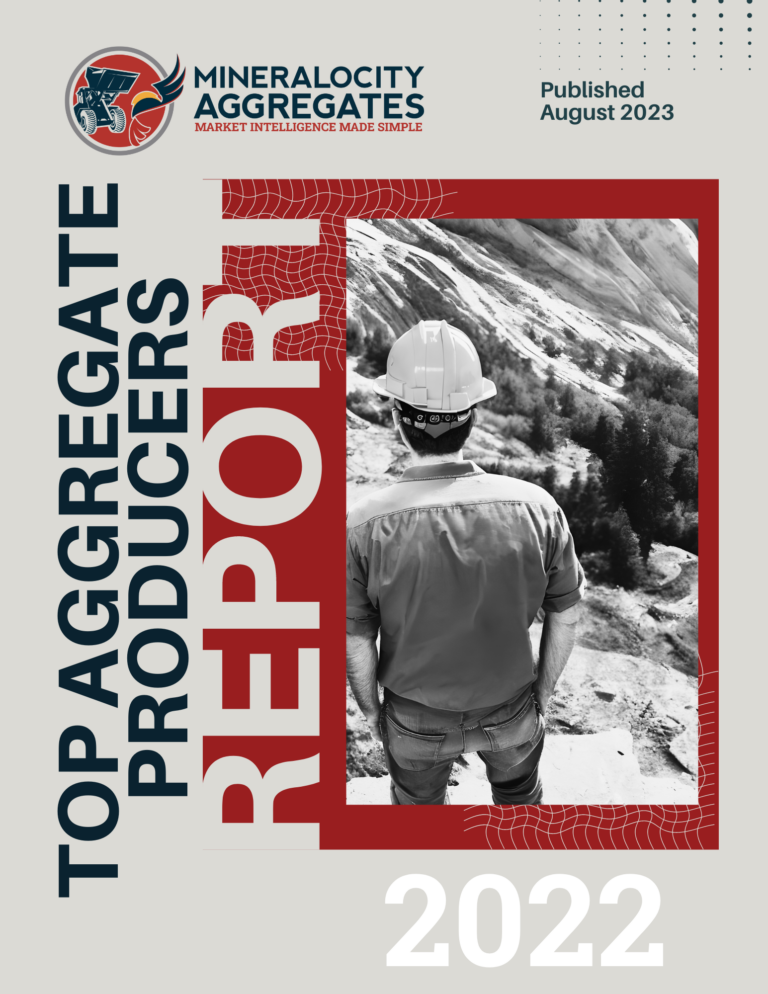
Report cover for the top three construction aggregate producers in each US state.

Unlock exclusive, groundbreaking market data with the 2022 Top Aggregate Producers Report. Don't miss out!

Gain a competitive edge with our 2022 Top Aggregate Producers Report! Get exclusive market share data on top producers in each U.S. state with market trends to strategize effectively. A must-have for every industry player!

25 Jul, 23

Understanding Aggregate Market Supply and Demand

The construction aggregate industry is foundational to infrastructure and real estate development. For producers, investors, or stakeholders, grasping supply and demand dynamics is paramount. Here’s a detailed yet straightforward guide on calculating aggregate market supply and demand.

Introduction to Aggregate Supply and Demand

At its essence, the concept of supply and demand forms the foundation of economics. They are two fundamental forces that interact to determine the price and quantity of goods in a market.

Supply represents the quantity of aggregates that producers are willing and able to bring to the market at a given price. Various factors influence this willingness, such as the cost of production, technological advancements, and the price of related goods. Simply put, supply is the producer’s side of the story. It answers the question: How much of the aggregate is available for sale at a specific price point?

On the other side of the equation, demand signifies the quantity of aggregates that consumers or businesses desire and are prepared to purchase at a certain price. It is influenced by factors like required specifications, location, end use, and the price of substitute or complementary goods. Demand provides insight into the consumer’s perspective, answering the question: How much of the aggregate do buyers want to purchase at a given price?

The interplay between these two forces, supply, and demand, determines the market equilibrium, where the amount producers are willing to sell matches the amount consumers want to buy. This equilibrium is essential for understanding the pricing and availability of goods in any economy, including the aggregates industry.

Calculating Demand

A deeper understanding of demand necessitates a few key steps:

  1. Per-Capita Consumption:
– Use historical data on aggregate consumption.
– Obtain population data, ideally from trusted sources like the [U.S. Census Bureau](https://www.census.gov/).
– Divide the estimated regional aggregate consumption by the population to ascertain annual per-capita averages.

  2. Identify the Key Sectors:
– Recognize primary aggregate consumers. This can encompass sectors like housing, road construction, or commercial projects.

  3. Forecast Activity & Consumption:
– Source industry reports and growth forecasts to anticipate future sectoral activity, such as the Dodge Construction Network Data that is integrated into Mineralocity Aggregates.
– Multiply expected units (e.g., miles of roads, houses constructed) by the estimated consumption amounts per-unit to estimate aggregate needs.

  4. Calculate Total Demand:
– Compile the figures from all sectors to get a comprehensive demand estimate.

Calculating Supply

For a comprehensive supply analysis:

  1. MSHA Data:
– Utilize data from the [Mine Safety and Health Administration (MSHA)](https://www.msha.gov/), which provides insights on operational hours for each permitted US producer.

  2. Identify Producers:
– Catalog all active aggregate producers in the chosen region.

  3. Estimate Production Capacity:
– For each producer, fetch their production potential, often found in annual reports, industry publications, or company websites.

  4. Adjust for Constraints:
– Take into account potential restrictions, be it environmental regulations, machinery limits, or labor constraints.

  5. Calculate Total Supply:
– Sum up the adjusted capacities of all producers to gauge the total available supply.

Balancing Supply and Demand:

With your supply and demand figures:

– A supply surplus could lead to reduced prices.

– If demand outstrips supply, prices might surge, offering expansion avenues for existing producers or entry points for newcomers.

Conclusion

Deciphering aggregate supply and demand sets the stage for astute decision-making in production, investment, and overarching strategy. While the above method offers a bird’s eye view, the intricate facets of transportation costs, quality diversities, and looming market trends call for meticulous analysis. This is where Mineralocity Aggregates shines, serving as a beacon for stakeholders. Our platform fuses granular data with incisive analysis, crafted through rigorous research, ensuring you not only stay informed but thrive in the industry’s ever-evolving landscape.

Ready to Unlock the Secrets of Successful Greenfield Site Evaluation?

Dive deeper into the world of construction aggregate production with our exclusive Greenfield Guide. Whether you’re a seasoned expert or just embarking on your aggregate adventure, this guide is your roadmap to identifying prime locations, assessing supply potential, and capturing significant market shares. Arm yourself with proven strategies, actionable insights, and essential formulas designed to propel your projects to unparalleled success. Don’t miss this chance to elevate your greenfield endeavors – grab your free copy of the Greenfield Guide now! 

10 Jul, 23

The 5 Key Benefits of Mineralocity Aggregates

Mineralocity Aggregates, our dynamic and versatile platform, is equipped with a plethora of features designed to elevate your operations. To get you started, here’s a curated list of the most beneficial functionalities that truly set it apart.

1) Wealth of Market Knowledge: The robust Mineralocity Aggregates platform provides clients with a vast range of market intelligence and knowledge, granting them access to insights that may not otherwise be available within their organization. 

2) Greenfield Opportunities: Our tool streamlines the often-complex process of site selection for new quarry development. While it doesn’t provide all the answers, it excels at identifying specific areas and regions suitable for new pit/quarry development, proving invaluable to any producers looking to expand. 

3) Strategic Planning: With features such as drivetime analysis and the ability to visualize competitors, markets, and transportation, Mineralocity Aggregates empowers producers to enhance strategic planning for existing operations. The platform enables producers to better utilize their operations and position themselves more competitively. 

4) Risk Mitigation: Mining comes with inherent risks. Mineralocity Aggregates helps alleviate some of these by providing the ability to assess both current and future markets. This enables producers to prepare for future demand changes and adjust production strategies accordingly. 

5) Identifying Trends and Market Opportunities: Many producers lack comprehensive market data outside of their local area, obscuring potential regional opportunities. Even a single quarry operation can use Mineralocity Aggregates to uncover opportunities for their products that might otherwise remain hidden. Most operators still rely on spreadsheets or even paper notebooks to track local markets. Our tool significantly enhances their capabilities with full visualization and the ability to identify trends and opportunities at a glance. Regularly updated data adds further peace of mind, making our platform an advantageous investment even for smaller producers.

In summary, Mineralocity Aggregates empowers producers to make better decisions, maintain or gain a competitive edge, and reduce risks within their business.  

Ready to Unlock the Secrets of Successful Greenfield Site Evaluation?

Dive deeper into the world of construction aggregate production with our exclusive Greenfield Guide. Whether you’re a seasoned expert or just embarking on your aggregate adventure, this guide is your roadmap to identifying prime locations, assessing supply potential, and capturing significant market shares. Arm yourself with proven strategies, actionable insights, and essential formulas designed to propel your projects to unparalleled success. Don’t miss this chance to elevate your greenfield endeavors – grab your free copy of the Greenfield Guide now!