28 Jul, 23

How to Determine Basic Regional Construction Aggregate Pricing

Navigating the complexities of the construction aggregate market can be daunting. One of the foundational elements to comprehend in this vast market is regional pricing. By grasping regional pricing trends, industry players can make more informed investment and operational decisions. This article provides a guide to determining basic regional construction aggregate pricing.

1. Understand the Basics of Aggregate Pricing

The price of construction aggregates isn’t just based on the material itself, but a combination of factors:

  • Extraction costs: The cost to mine or extract the material.
  • Processing costs: After extraction, the material must be processed to meet certain specifications.
  • Transportation costs: How far the aggregate needs to travel to reach its end-user, especially given that transportation can constitute a significant portion of the total cost.

2. Local Supply and Demand

The basic economic principles of supply and demand play a pivotal role:

  • Demand: Typically, regions with rapid urban development or infrastructure projects have higher aggregate demand.
  • Supply: The availability of natural resources in the region, and the number of operational quarries or sand pits, will affect supply and, consequently, prices.

3. Study Previous Price Trends
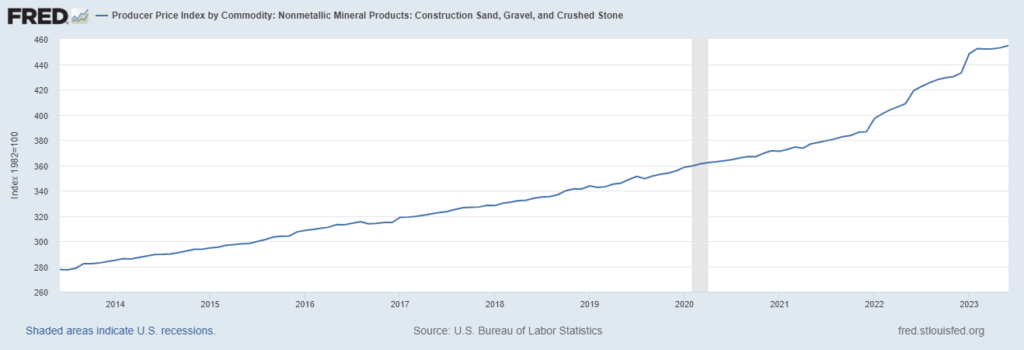
FRED graph of construction aggregate prices over the last 10 years.

Look for historical data on aggregate pricing in the desired region. Organizations such as the USGS (U.S. Geological Survey) track wholesale pricing trends on a statewide level, providing invaluable data for those seeking to understand past pricing fluctuations. This can give insight into how prices have changed over time and provide a basis for future predictions.

4. Government Regulations & Taxes

Government policies can significantly impact the cost:

  • Extraction licenses and permits: In some regions, it might be more expensive to get the necessary permissions to extract aggregates.
  • Environmental regulations: Adhering to environmental guidelines might add to operational costs, which could be passed on to buyers.
  • Taxes: Various taxes on mining operations or sales can affect pricing.

5. Quality of Aggregates

The quality and type of aggregate also play a role in its price:

  • Grade: Higher quality or specialized aggregates generally command higher prices.
  • Type: The demand for specific types of aggregates, such as granite, limestone, or sand, can vary regionally, impacting the price.

6. Competitive Landscape

Examine the number of competitors in the region:

  • Monopoly vs. Competition: A single dominant supplier in a region might have different pricing dynamics compared to a region with multiple competing suppliers.
  • Integration: Some suppliers might be integrated with construction companies, affecting how they price their products.

7. Consult Industry Reports and Experts

Industry reports often provide a wealth of data on regional pricing. Additionally, consulting with local industry experts or associations can offer insights that are not publicly available. 

8. Utilize Technological Tools

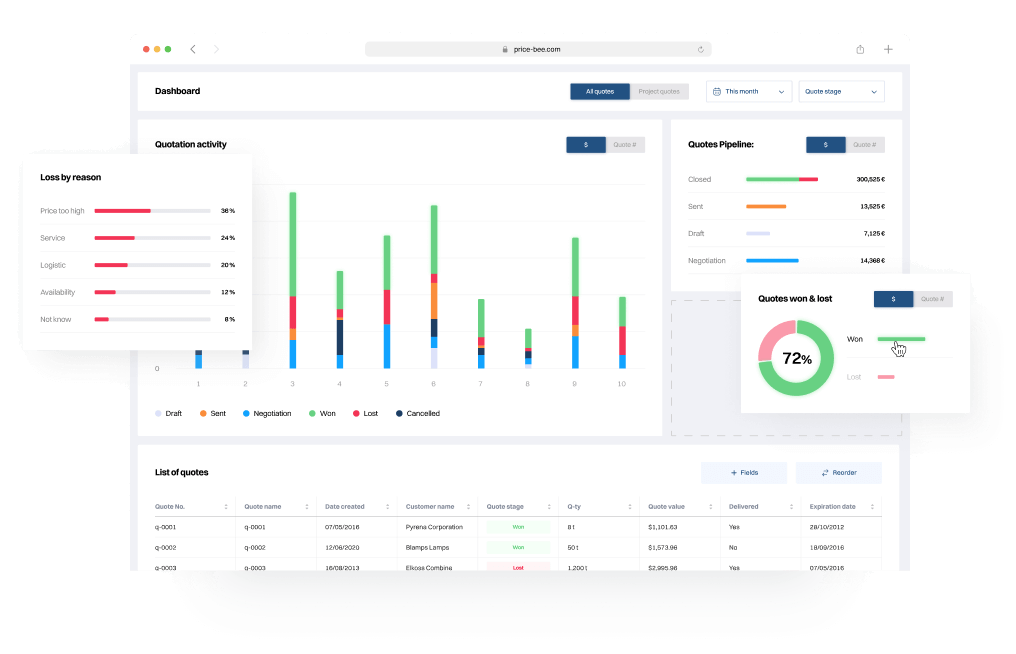
PriceBee is your go-to tool for industry specific price management functionality for the construction materials industry. Learn more at price-bee.com

Leveraging modern technology can provide dynamic insights into regional pricing. Platforms like Price-Bee have tools and expertise to help you develop a comprehensive pricing strategy.  Mineralocity Aggregates also offers detailed regional supply and demand data, ensuring businesses remain updated with current market dynamics.

Conclusion

Determining basic regional construction aggregate pricing isn’t solely about crunching numbers. It requires a comprehensive understanding of the local market, competitive dynamics, government regulations, and more. By systematically assessing each factor and utilizing advanced tools and resources, businesses can gain a clear picture of the pricing landscape, ensuring they remain competitive and informed in their decisions.
Ready to Unlock the Secrets of Successful Greenfield Site Evaluation?

Dive deeper into the world of construction aggregate production with our exclusive Greenfield Guide. Whether you’re a seasoned expert or just embarking on your aggregate adventure, this guide is your roadmap to identifying prime locations, assessing supply potential, and capturing significant market shares. Arm yourself with proven strategies, actionable insights, and essential formulas designed to propel your projects to unparalleled success. Don’t miss this chance to elevate your greenfield endeavors – grab your free copy of the Greenfield Guide now! 

21 Jul, 23

Sand Shortage or Not? A Realistic View on the Construction Sand Market

Hello, it’s Stuart Burgess here. Today, I traded my office chair for the sandy shoreline of a picturesque lake where I had the delightful opportunity to enjoy one of my favorite summertime hobbies – fishing. As I stood on the fine sandy surface, basking in the serene environment and reeling in a particularly feisty trout, a thought occurred to me: the debate surrounding the impending “sand shortage”. This brought me back to reality from the tranquility of my fishing spot, and I felt the urge to shed some light on this matter.

For a few years now, the media has been awash with headlines predicting doom and gloom over an imminent shortage of construction sand. Many articles have presented this as an insurmountable challenge, almost as if the sand beneath our feet is vanishing before our eyes. It’s crucial, however, to separate the wheat from the chaff and examine the situation from a pragmatic perspective.

Let’s be clear; we are not running out of sand in the literal sense. Our planet has an abundance of it, and the amount of available sand in the world isn’t diminishing to the point of extinction. However, we are witnessing a scenario where the accessibility and affordability of construction-grade sand are becoming increasingly challenging.

One of the main issues lies in the economics of transporting sand. It’s heavy and bulky, making transportation a significant part of the total cost. As construction sites become farther from their sand sources, transportation costs rise, and so does the total cost of sand. This is the crux of the matter: it’s not that we’re running out of sand; it’s that it’s getting more expensive to bring it to where we need it.

There’s also the issue of construction standards. Not just any sand can be used for construction purposes; it must meet specific criteria. This is another factor that’s contributing to the perceived shortage. As we use up the readily accessible sources of this ‘good’ sand, we’re left with sources that are either less suitable or more costly to use.

This is where manufactured sand comes in. It’s an alternative that can be produced to meet the required standards, offering a potential solution to the problem. However, it’s important to note that manufactured sand is generally more expensive than natural sand due to the production process, adding another layer of complexity to the issue.

But here’s where I’d like to leave you with a glimmer of optimism. This situation is not a death knell for the industry but rather an invitation for innovation and adaptation. It presents a window of opportunity for those ready to think outside the box.

At Burgex Mining Consultants and Mineralocity Aggregates, we believe that there are ample opportunities to open new construction sand producing operations. With creativity, perseverance, and the right tools, these challenges can be turned into prospects for growth. In fact, each update of the Mineralocity Aggregates platform incorporates the latest trends and data relevant to this issue, backed by over 800 hours of labor dedicated to ensuring the most reliable information.

Alarmist views of a sand shortage are useful in that they bring attention to a genuine issue. But they need to be taken with a grain of… well, sand. The reality is not that we’re running out of sand, but that we need to be smarter about how we source, use, and transport it. So next time you’re standing on a sandy beach, remember: The opportunities are as abundant as the grains beneath your feet.

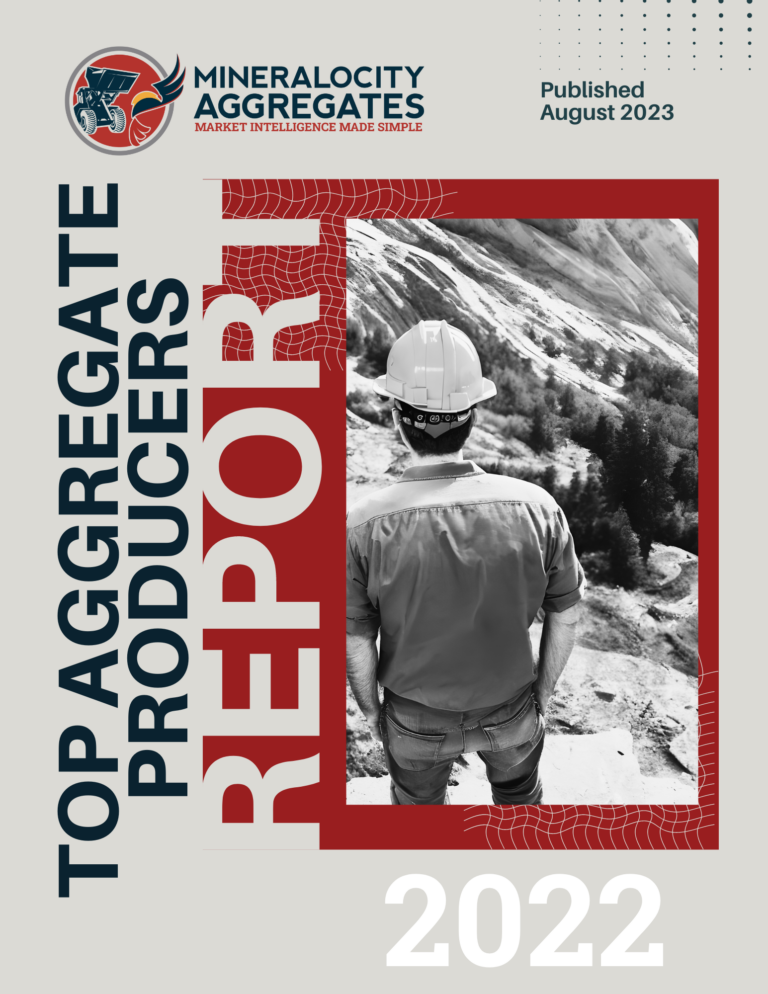
Report cover for the top three construction aggregate producers in each US state.

Unlock exclusive, groundbreaking market data with the 2022 Top Aggregate Producers Report. Don't miss out!

Gain a competitive edge with our 2022 Top Aggregate Producers Report! Get exclusive market share data on top producers in each U.S. state with market trends to strategize effectively. A must-have for every industry player!

17 Apr, 23

Mapped: Crushed Stone, Sand, and Gravel Production

Crushed stone, sand, gravel, and other construction aggregates account for half of the industrial minerals produced in the United States.

These materials represent a $29 billion per year business in the country.

The map above from our sponsor Burgex uses data from Mineralocity to show where aggregates are produced in America.

What Are Aggregate Minerals?

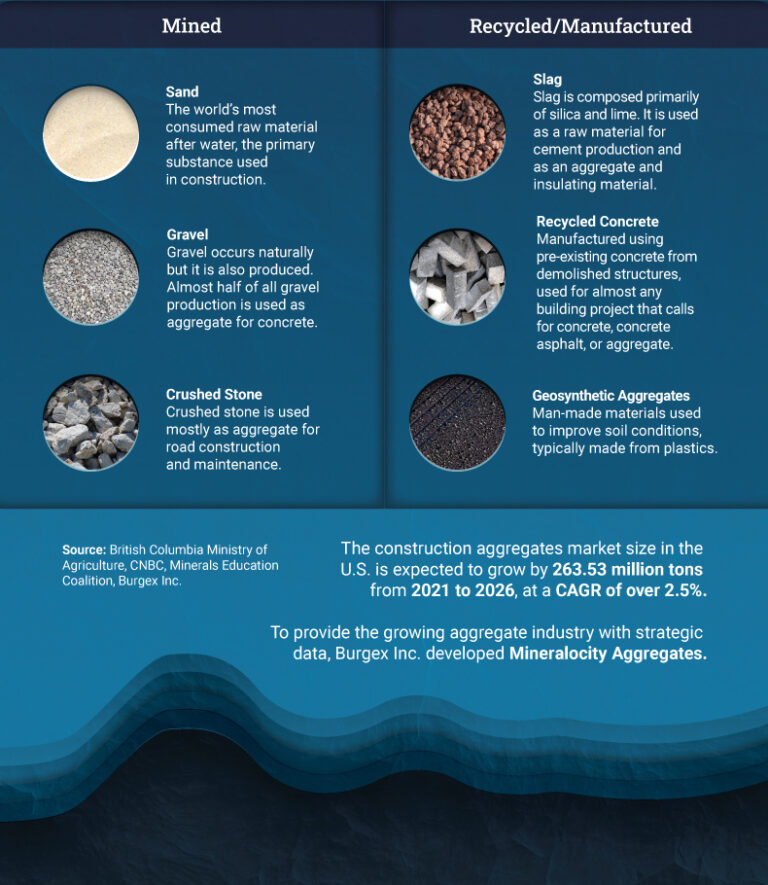
Aggregates are a variety of materials produced in pits or quarries, including sands, gravel, and crushed stone.

They are usually used in construction, with the largest proportion used to manufacture concrete.

  • Sand: The world’s most consumed raw material after water and the primary substance used in construction.
  • Gravel: It occurs naturally but it is also produced. Almost half of all gravel production is used as an aggregate for concrete.
  • Crushed Stone: Used mostly as an aggregate for road construction and maintenance. It is the leading nonfuel mineral commodity (by value of production) in America.

On average, each person in America drives demand for over 10,000 lbs of stone and around 7,000 lbs of sand and gravel per year.

Aggregate Production by State

Ten states produce more than 50% of the country’s construction aggregates.

The five leading States are, in descending order of total output: Texas, California, Florida, Ohio, and Pennsylvania.

Over 7,000 U.S. commercial aggregate companies are currently operating.

Growing urban areas across the U.S. and the rise in high-rise structures, which use concrete extensively, are expected to continue boosting demand for aggregates.

Additionally, maintenance of aging infrastructure across the country is expected to support the demand. In 2011, a study by the United States Geological Survey concluded that one-third of America’s major roads were in poor or mediocre condition, and over one-quarter of the bridges were either structurally deficient or functionally obsolete.

In this scenario, the aggregates market in the U.S. is expected to grow by 263.53 million tons from 2021 to 2026, at an annual average growth rate of over 2.5%.

Ready to Unlock the Secrets of Successful Greenfield Site Evaluation?

Dive deeper into the world of construction aggregate production with our exclusive Greenfield Guide. Whether you’re a seasoned expert or just embarking on your aggregate adventure, this guide is your roadmap to identifying prime locations, assessing supply potential, and capturing significant market shares. Arm yourself with proven strategies, actionable insights, and essential formulas designed to propel your projects to unparalleled success. Don’t miss this chance to elevate your greenfield endeavors – grab your free copy of the Greenfield Guide now! 

12 Apr, 23

Visualizing One Year of Sand, Gravel, and Stone Consumption in the U.S.

Aggregate minerals, which include raw materials such as sand, gravel, and stone, are the building blocks of our cities and an integral part of the U.S. economy.

From being used to make the concrete that shapes our buildings to being the foundation of our roads, aggregates are necessary to maintain our quality of life. But just how much do we rely on these raw materials each year?

To explore the answer, this visualization from our sponsor Burgex uses forecast data from Mineralocity Aggregates to show how much crushed stone, sand, and gravel the U.S. is expected to consume in 2023.

Crushed Stone

Crushed stone is a versatile material that has a variety of uses in road and building construction, landscaping, and other industries. It is typically made from various types of rock, such as limestone, dolomite, and granite, that have been broken down into different sizes.

According to projections by Minerolocity Aggregates, the U.S. will consume 1.73 billion U.S. tons of crushed stone in 2023.

Taking its 100 lb/ft³ density into account, that is equivalent to a cube 3,259 feet high. That’s nearly double the height of the One World Trade Center, the tallest building in the U.S., standing at 1,776 feet as an homage to the country’s Declaration of Independence.

It’s also worth considering per capita usage to grasp the magnitude of aggregates we depend on in our daily lives. In 2023, each American is projected to account for the consumption of approximately 5.2 tons of crushed stone.

While crushed stone production is prevalent across the United States, here are some states that sold the most of this aggregate mineral in 2021.

State2021 Crushed Stone Sales in Thousands of U.S. Tons
Texas187,393
Florida104,609
Pennsylvania96,673
Ohio77,052
California56,218

With 99% of all U.S. demand being met by domestic production in 2022, crushed stone is an integral part of the U.S. economy.

Sand and Gravel

Sand and gravel are essential natural resources that are widely used in construction and agriculture. They also have wide uses in industrial activities, such as glass manufacturing, foundries, and metal casting, as well as in recreational activities, such as volleyball courts, golf courses, and beaches.

In 2023, the U.S. is forecasted to consume 1.12 billion U.S. tons of sand and gravel. This is more than 3.3 tons per person. 

Here are the top producers of sand and gravel in the United States.

State2021 Sand and Gravel Sales in Thousands of U.S. Tons
California125,663
Texas104,940
Ohio38,801
Florida23,920
Pennsylvania7,529

Aggregate minerals are the building blocks of our modern lives.

With over 7,000 commercial aggregate companies operating in the U.S. (while contributing $31 billion to the economy in 2022), their importance to our lives and the economy should not be underestimated.