Contact Us Today

Mineralocity

See us at AGG1 March 25-27th, Booth 1106

17 Apr, 23

Mapped: Crushed Stone, Sand, and Gravel Production

Crushed stone, sand, gravel, and other construction aggregates account for half of the industrial minerals produced in the United States.

These materials represent a $29 billion per year business in the country.

The map above from our sponsor Burgex uses data from Mineralocity to show where aggregates are produced in America.

What Are Aggregate Minerals?

Aggregates are a variety of materials produced in pits or quarries, including sands, gravel, and crushed stone.

They are usually used in construction, with the largest proportion used to manufacture concrete.

  • Sand: The world’s most consumed raw material after water and the primary substance used in construction.
  • Gravel: It occurs naturally but it is also produced. Almost half of all gravel production is used as an aggregate for concrete.
  • Crushed Stone: Used mostly as an aggregate for road construction and maintenance. It is the leading nonfuel mineral commodity (by value of production) in America.

On average, each person in America drives demand for over 10,000 lbs of stone and around 7,000 lbs of sand and gravel per year.

Aggregate Production by State

Ten states produce more than 50% of the country’s construction aggregates.

The five leading States are, in descending order of total output: Texas, California, Florida, Ohio, and Pennsylvania.

Over 7,000 U.S. commercial aggregate companies are currently operating.

Growing urban areas across the U.S. and the rise in high-rise structures, which use concrete extensively, are expected to continue boosting demand for aggregates.

Additionally, maintenance of aging infrastructure across the country is expected to support the demand. In 2011, a study by the United States Geological Survey concluded that one-third of America’s major roads were in poor or mediocre condition, and over one-quarter of the bridges were either structurally deficient or functionally obsolete.

In this scenario, the aggregates market in the U.S. is expected to grow by 263.53 million tons from 2021 to 2026, at an annual average growth rate of over 2.5%.

Ready to Unlock the Secrets of Successful Greenfield Site Evaluation?

Dive deeper into the world of construction aggregate production with our exclusive Greenfield Guide. Whether you’re a seasoned expert or just embarking on your aggregate adventure, this guide is your roadmap to identifying prime locations, assessing supply potential, and capturing significant market shares. Arm yourself with proven strategies, actionable insights, and essential formulas designed to propel your projects to unparalleled success. Don’t miss this chance to elevate your greenfield endeavors – grab your free copy of the Greenfield Guide now! 

12 Apr, 23

Visualizing One Year of Sand, Gravel, and Stone Consumption in the U.S.

Aggregate minerals, which include raw materials such as sand, gravel, and stone, are the building blocks of our cities and an integral part of the U.S. economy.

From being used to make the concrete that shapes our buildings to being the foundation of our roads, aggregates are necessary to maintain our quality of life. But just how much do we rely on these raw materials each year?

To explore the answer, this visualization from our sponsor Burgex uses forecast data from Mineralocity Aggregates to show how much crushed stone, sand, and gravel the U.S. is expected to consume in 2023.

Crushed Stone

Crushed stone is a versatile material that has a variety of uses in road and building construction, landscaping, and other industries. It is typically made from various types of rock, such as limestone, dolomite, and granite, that have been broken down into different sizes.

According to projections by Minerolocity Aggregates, the U.S. will consume 1.73 billion U.S. tons of crushed stone in 2023.

Taking its 100 lb/ft³ density into account, that is equivalent to a cube 3,259 feet high. That’s nearly double the height of the One World Trade Center, the tallest building in the U.S., standing at 1,776 feet as an homage to the country’s Declaration of Independence.

It’s also worth considering per capita usage to grasp the magnitude of aggregates we depend on in our daily lives. In 2023, each American is projected to account for the consumption of approximately 5.2 tons of crushed stone.

While crushed stone production is prevalent across the United States, here are some states that sold the most of this aggregate mineral in 2021.

State2021 Crushed Stone Sales in Thousands of U.S. Tons
Texas187,393
Florida104,609
Pennsylvania96,673
Ohio77,052
California56,218

With 99% of all U.S. demand being met by domestic production in 2022, crushed stone is an integral part of the U.S. economy.

Sand and Gravel

Sand and gravel are essential natural resources that are widely used in construction and agriculture. They also have wide uses in industrial activities, such as glass manufacturing, foundries, and metal casting, as well as in recreational activities, such as volleyball courts, golf courses, and beaches.

In 2023, the U.S. is forecasted to consume 1.12 billion U.S. tons of sand and gravel. This is more than 3.3 tons per person. 

Here are the top producers of sand and gravel in the United States.

State2021 Sand and Gravel Sales in Thousands of U.S. Tons
California125,663
Texas104,940
Ohio38,801
Florida23,920
Pennsylvania7,529

Aggregate minerals are the building blocks of our modern lives.

With over 7,000 commercial aggregate companies operating in the U.S. (while contributing $31 billion to the economy in 2022), their importance to our lives and the economy should not be underestimated.

13 Jun, 22

Introducing Mineralocity Aggregates -The New Flagship Mineral Market Analysis Tool

The mining analysis team at Burgex has been hard at work over the past several years developing internal tools and systems for conducting complex market analysis studies of mineral commodities. One of the top priorities for the team has been creating a national geographical information system for dynamically analyzing construction aggregate supply and demand trends. What began as a linear system of registering estimated production and demand on a site-by-site basis has transformed into a robust structure of mineral market analysis that includes highly advanced capabilities previously only imagined. Burgex is excited to introduce Mineralocity Aggregates – The Burgex flagship system for analysis of local and regional construction aggregate market trends. A highly advanced, cloud based, visual analysis of regional construction aggregate trends and megaregion development.

Feature Highlights of Mineralocity Aggregates include: 

  • Estimated annual production mapped for all commercial US producers – including crushed stone, sand & gravel. All production locations geo-referenced and analyzed (over 3K+ locations nationwide)
  • Highly advanced nationwide population grid
  • Annual per capita demand mapped in high resolution grids
  • Megaregion Networks
  • Mapping of growth areas by census tract
  • Geology units mapped and ranked by estimated annual aggregate production
  • Population Bivariate Analysis of population growth and population density changes
  • Housing permit Analysis
  • County GDP Analysis
  • State by State S&P Ratings and Outlooks
  • Density of Stone Producers
  • Density of Sand/Gravel Producers
  • Railroads, Highways, and other transportation vectors
  • Transportation based market radius generation
  • Wetland Maps
  • Burgex Market Grades
  • Restricted Development Areas
  • Exclusive support
  • And more!
The Mineralocity Aggregates Platform will be available on a subscription basis in the spring of 2022. The platform is designed to give a powerful competitive advantage to all who use it, including; construction aggregate producers, aggregate industry suppliers, market analysts, consultants, investors, and researchers. From the selection of a new greenfield construction aggregate development site to placement of a supply distribution warehouse, this tool will greatly enhance both the speed and accuracy of your work – providing invaluable insights for your business. If you are interested in learning more about the Mineralocity Aggregates Platform and want to subscribe for future updates, please send us an email at info@burgex.com or fill out our contact form. Source: https://burgex.com/introducing-mineralocity-aggregates/
20 Apr, 22

Huge Milestone Achieved as Mineralocity Aggregates Supply and Demand Market Analysis Completed for Entire United States

A major milestone was achieved this week as the Burgex Inc. Mineralocity Aggregates Team was able to complete a high-resolution visual mapping of estimated construction aggregate supply and demand analysis across the entire United States. (Graphic: Business Wire)

SANDY, Utah–(BUSINESS WIRE)–A major milestone was achieved this week as the Burgex Inc. Mineralocity Aggregates Team completed a high-resolution visual mapping of estimated construction aggregate supply and demand analysis across the entire United States.

This analysis was completed using millions of individual supply and demand datapoints to create an interactive raster grid that shows supply and demand balance that can be visualized on a local, regional, and national level. In addition to completing this analysis and visual map of supply and demand conditions, the Mineralocity Aggregates team completed an additional supply and demand analysis that shows the predicted aggregate market change over a five-year period to 2025. This analysis was completed using a highly advanced population model that has been developed by the Burgex Inc. analysis team over several years.

Stuart Burgess, Chairman of Burgex Inc. and Manager for the Mineralocity Aggregates launch team, stated, “In addition to individually geographically locating all 7000+ commercial aggregate producers in the United States, completing this supply and demand analysis represents a huge milestone towards the launch of Mineralocity Aggregates. Completing this phase required an enormous amount of computing power, as well as developing and coding several proprietary models for estimating the production of each individual operation, refining population and per-capita demand, and assembling both into a practical format. This latest analysis is just one more tool that will be available to help drive modern market analysis for construction aggregates. We are driving modernization in market analysis methods for essential mineral goods – like construction aggregates. This has never been done before and has required some extraordinary innovation on the part of Jake Tanner, Lead GIS Developer.”

Next development steps will involve combining this national supply and demand analysis with other new levels of analysis, such as geology and land status polygons, to generate additional analysis that will be useful for aggregate producers, industry suppliers, analysts, and more. These layers and many more will be available to full subscribers of the Mineralocity Aggregates platform. These tools are being designed to assist both producers and industry suppliers alike with market analysis and business development activities.

Mineralocity Aggregates, in partnership with Rock Products, will also be launching its Digital Aggregates Atlas. It will be available soon and free for use without a subscription. Learn more: www.burgex.com.

Contacts

Jenny Deems
801-648-6463
www.burgex.com
jdeems@burgex.com

Source: https://www.businesswire.com/news/home/20220420005359/en/Huge-Milestone-Achieved-as-Mineralocity-Aggregates-Supply-and-Demand-Market-Analysis-Completed-for-Entire-United-States 

13 Oct, 21

How Mineralocity Aggregates Is a Game Changer

Geographical information systems (or GIS) are revolutionizing how the modern world visualizes, consumes, and uses market information, especially for mineral market analysis studies. Not all markets are entirely geographically based, but virtually all of them have some sort of geographic tie. Video streaming services, for example, can be utilized anywhere in the world with internet access and a VPN perhaps – but determining locations for best serving those markets with infrastructure is very geographically based. There are few businesses that would not benefit from some sort of market study.

Mineral Market Analysis in Mining

Within the mining industry, transportation logistics and costs (as well as environmental, regulatory, labor access, and utility factors) weigh heavily on every operation worldwide. The viability of these operations hinges on the economic interplay of the factors mentioned above. Within the construction aggregate industry specifically, transportation logistics are critical.

Mineral Market Analysis for Construction Aggregates

Transportation or other construction projects are generally going to utilize the nearest available aggregate product in spec. It is not uncommon for transportation costs to exceed the purchase price of the material itself. Therefore it makes the most economic sense for a contractor to buy from the nearest quarry or pit to produce the needed aggregate.  In many parts of the world, it is possible to locate quarries and pits near consuming populations, but in other cases, they have been found hundreds of miles away and will need to be transported. Aggregate producers will build yards and facilities for distribution closer to high-demand regions. In any case, planning for quarry placement extends far beyond just finding a suitable geological unit with available land for development. The placement of these quarries begins with conducting a mineral market analysis study.

Traditional Mineral Market Analysis

Traditional market research for minerals and other consumables relies on tabulating estimated supply and demand based on knowns, projections, and assumptions. Populations are calculated based on census reports by incorporated area, census tract, or county. This population is multiplied by the estimated consumption of the product over a designated time (day, month, year) to generate an estimated demand. For construction aggregates, demand is generally calculated by tons (or tonnes) per capita annually within a designated region. Supply is estimated simply by adding up anticipated production (or distribution) within the same area. The formula calculates supply and demand on an individual site basis – generally within a spreadsheet. Depending on the complexity of the market is analyzed, this can take anywhere from days to weeks. A typical mineral market analysis for a greenfield site may take several weeks and may require on-the-ground intelligence to determine accurate supply and demand.

The Mineralocity Aggregates Revolution

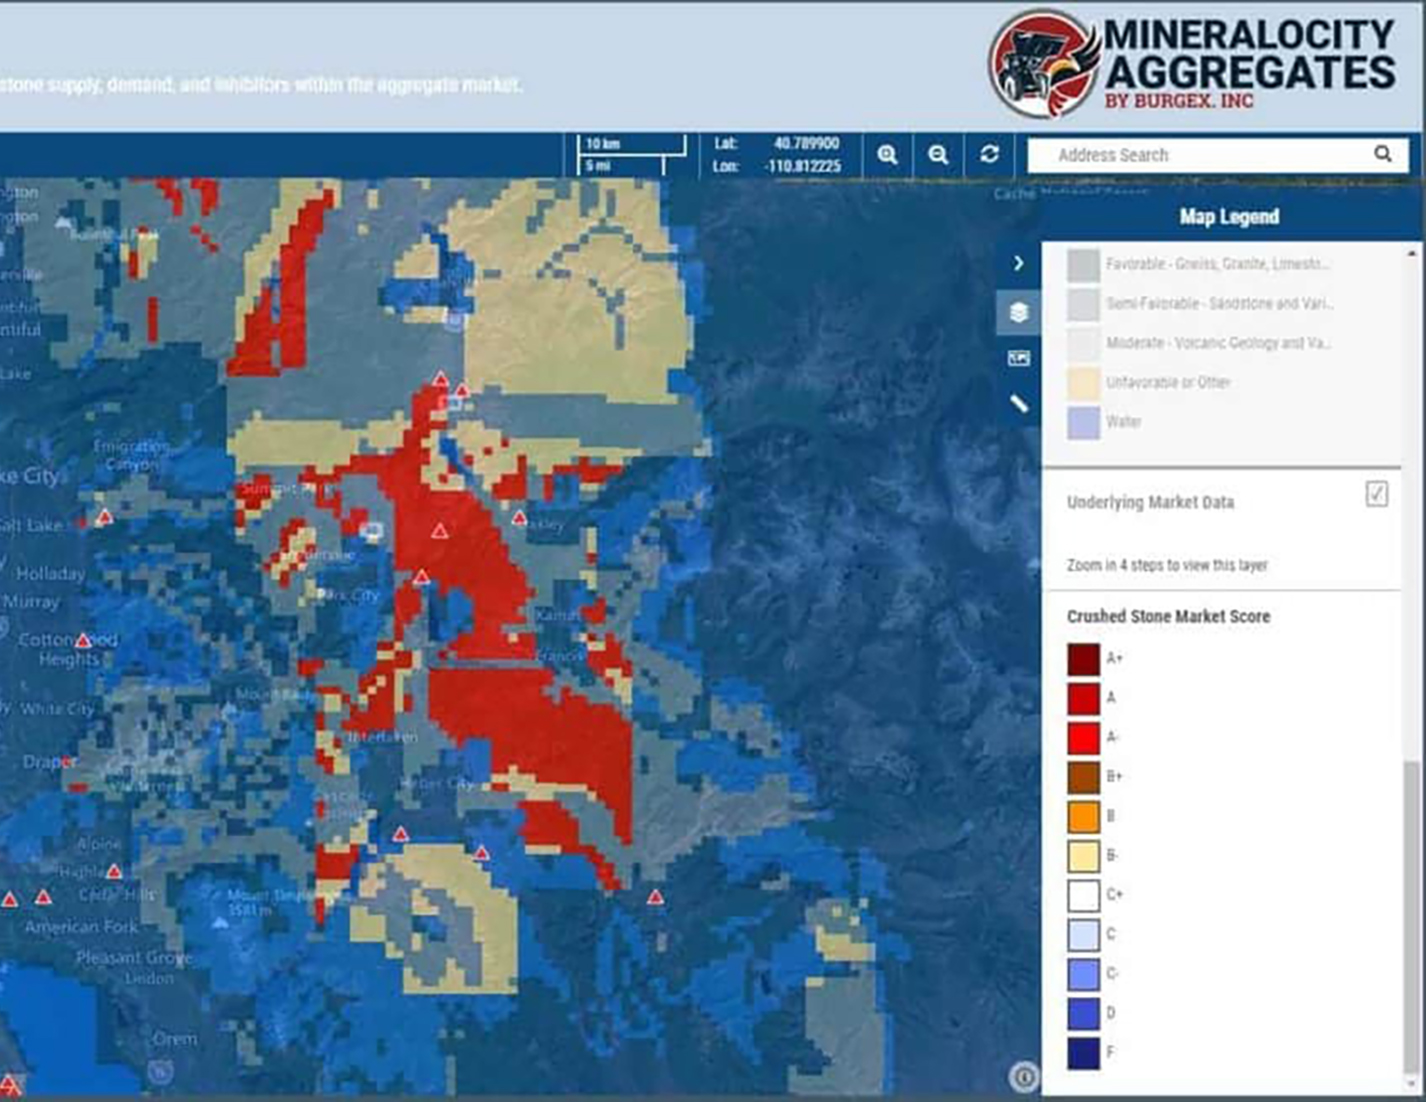
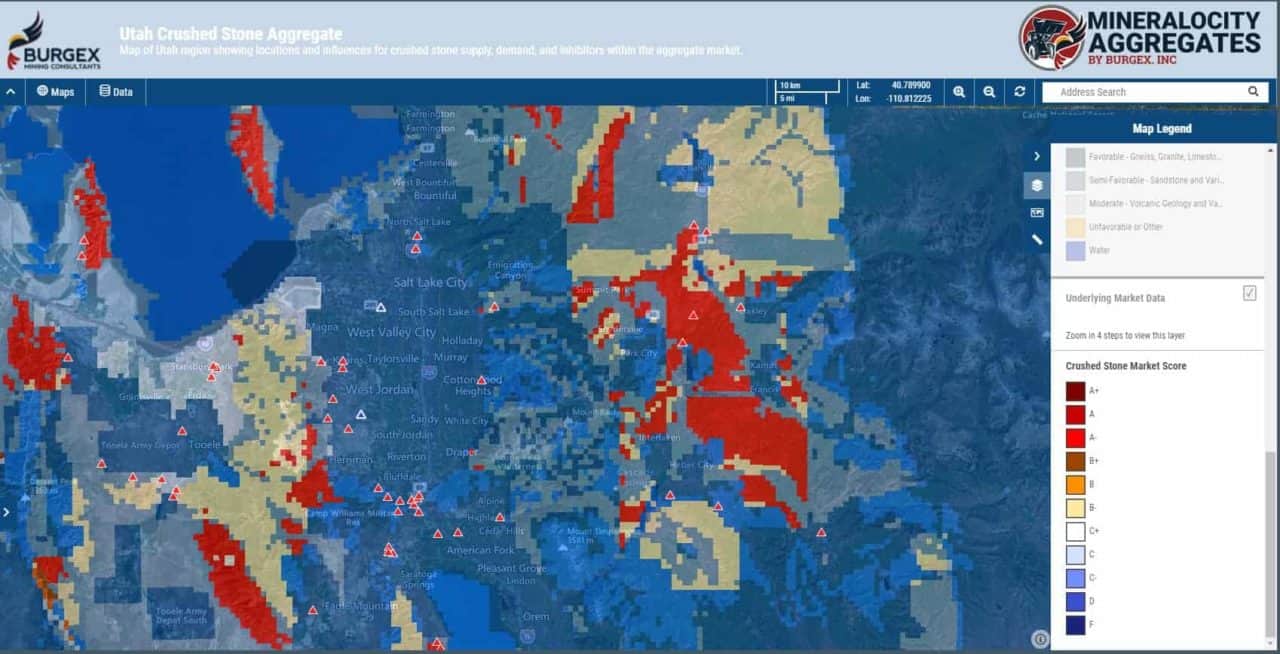
With the advanced GIS tools utilized by Mineralocity Aggregates, dynamic versions of these same calculations are run on a matrix of granular grids of less than one square mile that cover entire states and regions. This generates a high-resolution interactive layer that can be used to identify areas of supply deficit – areas that could be ideal for the placement of a new quarry, pit, or distribution yard. Not only can areas of deficit be identified quickly on a regional or statewide basis, but the platform provides a host of other interactive data layers – such as the estimated annual production of existing commercial quarries, favorable geological units that currently host the significant output of construction aggregates, and regional economic and population growth indicators for future planning and projections.

The Mineralocity Aggregates platform will generate weeks or even months’ worth of actionable mineral market analysis research within hours. It is anticipated that this platform will find vital use with local, regional, and national construction aggregate producers to analyze current operations, select greenfield sites, and develop long-term plans for growth. The platform will also be helpful for those who supply the aggregate industry, contractors who regularly purchase construction aggregates, and researchers, both governmental and private, who wish to understand infrastructure construction and growth trends on an intimate national scale.

Burgex plans to continue developing the Mineralocity Aggregates platform to further enhance mineral market analysis through the dynamic study of transportation vectors, pricing, and demand growth projections of up to fifty years. Contact us today to learn more and register for updates before the anticipated platform release in the spring of 2022. In addition to Mineralocity Aggregates, Burgex has advanced capabilities to conduct mineral market analysis studies for a wide range of mineral commodities.

Source: https://burgex.com/how-mineralocity-aggregates-is-a-gamechanger/