17 Apr, 23

Mapped: Crushed Stone, Sand, and Gravel Production

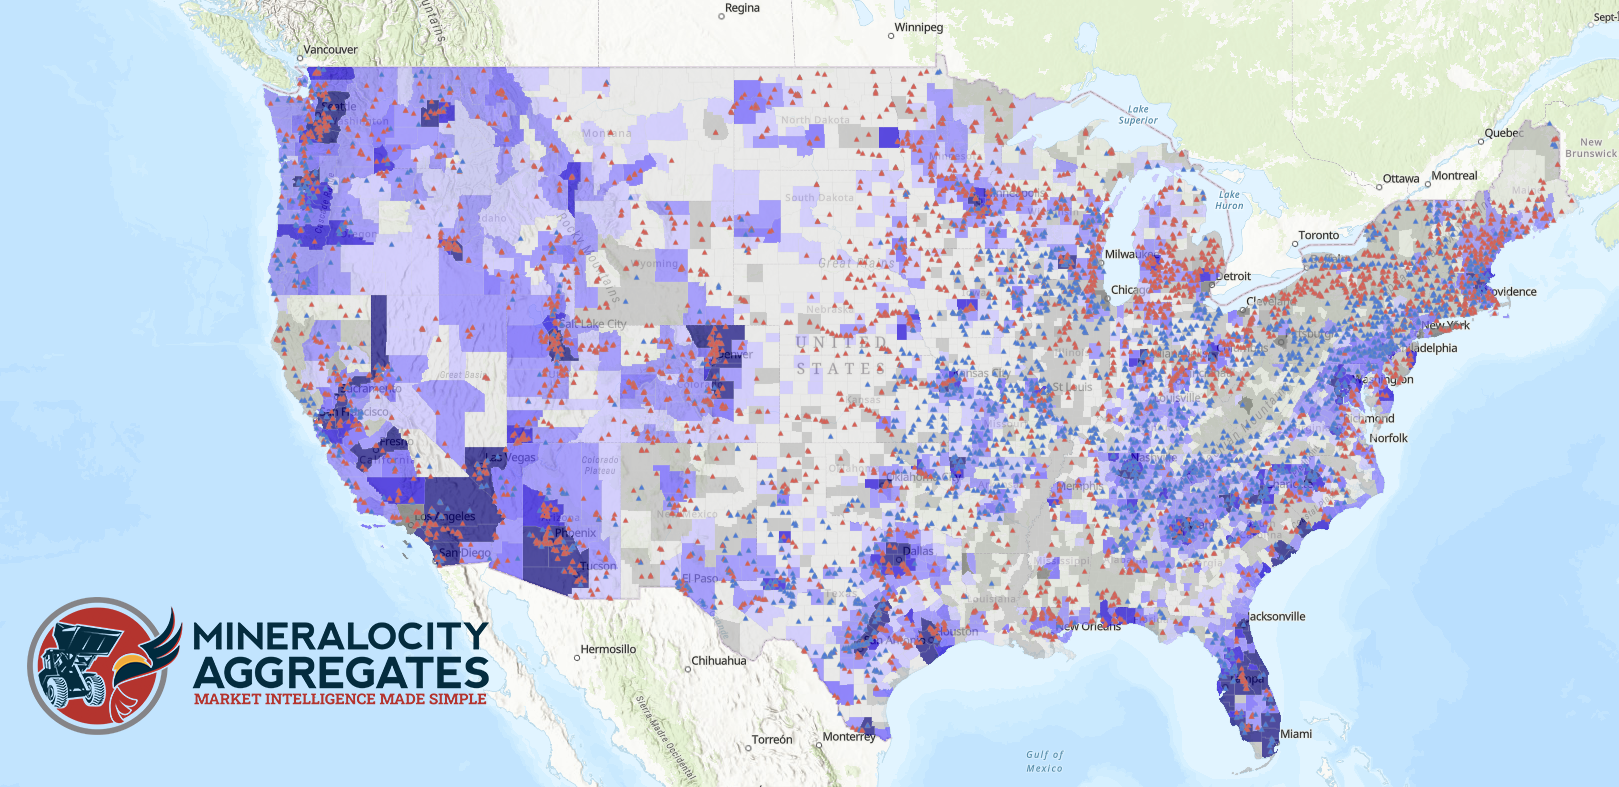
Crushed stone, sand, gravel, and other construction aggregates account for half of the industrial minerals produced in the United States.

These materials represent a $29 billion per year business in the country.

The map above from our sponsor Burgex uses data from Mineralocity to show where aggregates are produced in America.

What Are Aggregate Minerals?

Aggregates are a variety of materials produced in pits or quarries, including sands, gravel, and crushed stone.

They are usually used in construction, with the largest proportion used to manufacture concrete.

  • Sand: The world’s most consumed raw material after water and the primary substance used in construction.
  • Gravel: It occurs naturally but it is also produced. Almost half of all gravel production is used as an aggregate for concrete.
  • Crushed Stone: Used mostly as an aggregate for road construction and maintenance. It is the leading nonfuel mineral commodity (by value of production) in America.

On average, each person in America drives demand for over 10,000 lbs of stone and around 7,000 lbs of sand and gravel per year.

Aggregate Production by State

Ten states produce more than 50% of the country’s construction aggregates.

The five leading States are, in descending order of total output: Texas, California, Florida, Ohio, and Pennsylvania.

Over 7,000 U.S. commercial aggregate companies are currently operating.

Growing urban areas across the U.S. and the rise in high-rise structures, which use concrete extensively, are expected to continue boosting demand for aggregates.

Additionally, maintenance of aging infrastructure across the country is expected to support the demand. In 2011, a study by the United States Geological Survey concluded that one-third of America’s major roads were in poor or mediocre condition, and over one-quarter of the bridges were either structurally deficient or functionally obsolete.

In this scenario, the aggregates market in the U.S. is expected to grow by 263.53 million tons from 2021 to 2026, at an annual average growth rate of over 2.5%.

Ready to Unlock the Secrets of Successful Greenfield Site Evaluation?

Dive deeper into the world of construction aggregate production with our exclusive Greenfield Guide. Whether you’re a seasoned expert or just embarking on your aggregate adventure, this guide is your roadmap to identifying prime locations, assessing supply potential, and capturing significant market shares. Arm yourself with proven strategies, actionable insights, and essential formulas designed to propel your projects to unparalleled success. Don’t miss this chance to elevate your greenfield endeavors – grab your free copy of the Greenfield Guide now! 

12 Apr, 23

Visualizing One Year of Sand, Gravel, and Stone Consumption in the U.S.

Aggregate minerals, which include raw materials such as sand, gravel, and stone, are the building blocks of our cities and an integral part of the U.S. economy.

From being used to make the concrete that shapes our buildings to being the foundation of our roads, aggregates are necessary to maintain our quality of life. But just how much do we rely on these raw materials each year?

To explore the answer, this visualization from our sponsor Burgex uses forecast data from Mineralocity Aggregates to show how much crushed stone, sand, and gravel the U.S. is expected to consume in 2023.

Crushed Stone

Crushed stone is a versatile material that has a variety of uses in road and building construction, landscaping, and other industries. It is typically made from various types of rock, such as limestone, dolomite, and granite, that have been broken down into different sizes.

According to projections by Minerolocity Aggregates, the U.S. will consume 1.73 billion U.S. tons of crushed stone in 2023.

Taking its 100 lb/ft³ density into account, that is equivalent to a cube 3,259 feet high. That’s nearly double the height of the One World Trade Center, the tallest building in the U.S., standing at 1,776 feet as an homage to the country’s Declaration of Independence.

It’s also worth considering per capita usage to grasp the magnitude of aggregates we depend on in our daily lives. In 2023, each American is projected to account for the consumption of approximately 5.2 tons of crushed stone.

While crushed stone production is prevalent across the United States, here are some states that sold the most of this aggregate mineral in 2021.

State2021 Crushed Stone Sales in Thousands of U.S. Tons
Texas187,393
Florida104,609
Pennsylvania96,673
Ohio77,052
California56,218

With 99% of all U.S. demand being met by domestic production in 2022, crushed stone is an integral part of the U.S. economy.

Sand and Gravel

Sand and gravel are essential natural resources that are widely used in construction and agriculture. They also have wide uses in industrial activities, such as glass manufacturing, foundries, and metal casting, as well as in recreational activities, such as volleyball courts, golf courses, and beaches.

In 2023, the U.S. is forecasted to consume 1.12 billion U.S. tons of sand and gravel. This is more than 3.3 tons per person. 

Here are the top producers of sand and gravel in the United States.

State2021 Sand and Gravel Sales in Thousands of U.S. Tons
California125,663
Texas104,940
Ohio38,801
Florida23,920
Pennsylvania7,529

Aggregate minerals are the building blocks of our modern lives.

With over 7,000 commercial aggregate companies operating in the U.S. (while contributing $31 billion to the economy in 2022), their importance to our lives and the economy should not be underestimated.

14 Feb, 23

February Newsletter: How a Mining Engineer uses Mineralocity

Q: What is your role at Burgex?

I am a mining engineer, specifically within the consulting group. I started my career seven years ago doing mining engineering work in the construction aggregate space and have been at Burgex for more than three years.

Q: What types of projects do you typically work on?

Mine design, and mine planning such as mine/site layouts, pit shells, volume calculations, production schedules, cycle times, equipment matching and selection.
Valuation work that focuses on implementing a mine plan and calculating operating costs into the life-of-mine plan, all of which feed into the valuation.
I also run models and analyses on currently operating quarries to estimate annual production to evaluate supply that is entering a particular market.

Q: When a client comes to Burgex with a general area of interest, how do you help them determine if a site is worth pursuing?

Before Mineralocity, we did a lot of Preliminary Assessment for Site Suitability (PASS) reports. They are very high-level reviews that report on the local market of a site, and the technical feasibility of that site. An analysis is done on a site-by-site basis, as the models require input of the tract boundary to run properly. We give the site a letter grade from A+ to F, in two categories: market, and technical feasibility. This allows our clients to quickly compare multiple sites and helps them decide where to allocate resources to progress further.

Q: What if a client only has a vague idea of where they want to look to expand or start a new greenfield location?

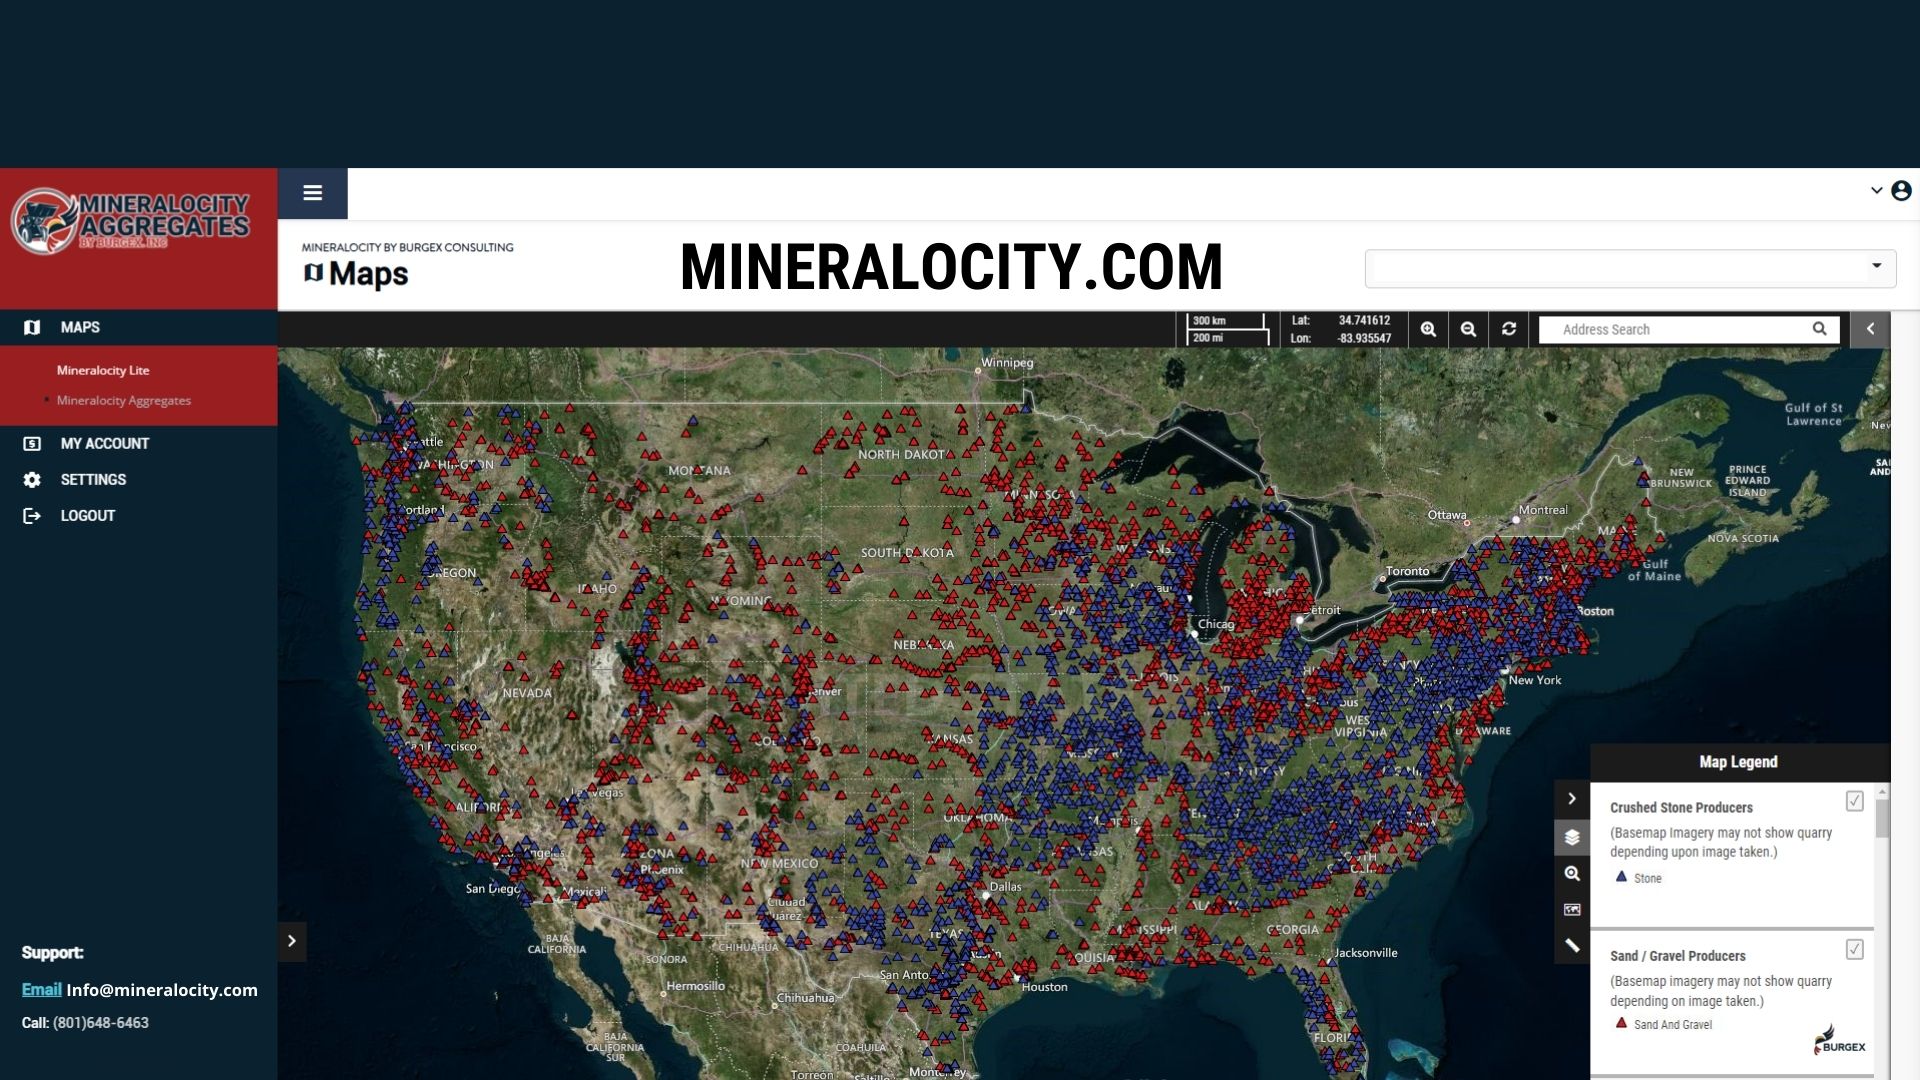
This is where Mineralocity comes in. It’s hard to choose an area, but we have an idea of where there is a lot of demand for aggregate. It’s really difficult to say whether one area is better than another. It depends on all the other suppliers in the area and distance from metro or population centers, so it can be very difficult to look generally, like a full state or region, unless you have a tool like Mineralocity. With Mineralocity the entire United States can be visualized, and every active producer for construction aggregate can be seen with our GIS-based platform. The map has colorized symbology based on PASS report scoring for easy understanding of where to start looking. With a map like that, it is easy to see how one area compares with another. We also use Mineralocity to perform market share analysis and help our clients identify possible growth opportunities via mergers and acquisitions (M&A).

Q: If a client did the initial market study themselves using Mineralocity, how much time could they potentially save?

Well, it’s not terribly complicated to analyze a potential site if you have the data, and for the most part clients usually have a good idea as to whether it is a “good site“ or not. What would really save a client time is to run this analysis repeatedly on multiple potential site locations. The amount of data you can get from Mineralocity is the same as one of our professional analysis PASS reports, which can take a few hours just to find out that it is not a good site, or whether they should look somewhere else. In Mineralocity, with a simple click of the mouse they will instantly know if they should pursue a location or not. That is a real time-saver.

It is amazing how much data we have incorporated into the platform, but there is so much more on the back end that feeds into it. When a client does this on their own they must comb through so much data, which is incredibly time-consuming. Mineralocity can show a summary of all the data very concisely. If more depth or explanation is needed for all the datasets incorporated, our consulting team can provide that additional expertise.

Q: Ideally clients will use the Mineralocity platform to refine their area of interest to a couple of sites. How does Burgex further help them advance that area?

Mineralocity can really help clients discover a more refined area, but it’s hard to put all the back end data into the platform in a way that it can be seen.

The ideal workflow would be:

Client picks a site and evaluates it using Mineralocity to determine where there is good demand, population, supply in the area, favorable geology, and where the population is growing or declining. We are currently working on adding parcel data to determine if the land is available or not.

Burgex assesses that specific site and investigates it more deeply, starting with its geology to make sure the material on site passes Department of Transportation specifications. Burgex then investigates the specific market, pricing, production costs, and conducts a study of where in the market that material will go.

By doing this further analysis, we can give the client a fully detailed market report on their potential site and they can make an educated decision on whether to pursue the site or not.


GIS, mineralocity, aggregates, construction, market

The Evolution of Mineralocity

By: Jenny Deems, Inside Sales Rep for Mineralocity

When I started at Burgex Mining Consultants more than two-and-a-half years ago, Mineralocity Aggregates was an idea, a thought, a “what if” dreamed up by Stuart Burgess and Chris Summers. Today, as Mineralocity Aggregates team lead, I have the privilege of introducing Mineralocity Aggregates to government agencies, consulting firms, investment companies, aggregate producers, and suppliers to the aggregate industry. I assist subscribers and potential subscribers with access to the platform, billing questions, functionality, data interpretation, and more.

It has been my pleasure to watch this great idea become an even greater reality. I have watched the idea turn into a concept, then a plan, then go through development and production, and finally to be introduced into the market. Mineralocity Aggregates really is Market Intelligence Made Simple.

Now suppliers to the aggregate industry use this powerful tool to better understand their customers and products, and to focus on and create sales strategy plans. Producers gain a better understanding of their competition to develop plans for M&A as well as greenfield expansion.

Mineralocity Aggregates was officially introduced to the public on June 15, 2022. With input from beta testers, subscribers, and free trial users, we have determined which functionalities users desire. By incorporating Dodge Construction Data into the platform we will now enable users to see where funds will be spent so those areas of growth can be targeted. We will also launch a new version of Mineralocity Aggregates that will be more interactive and will allow users to import and export data.

I enjoy the opportunity to watch Mineralocity Aggregates grow from an idea into a valuable tool for our subscribers.

If you’re attending CONEXPO CON/AGG, stop by our booth for a demonstration and see for yourself how Mineralocity can benefit you and get your black truck! March 13th– 18th, booth N10321

If you have any questions, please feel free to reach out to me personally at
801-648-6463 or jdeems@burgex.com.

30 Jun, 22

Mineralocity Aggregates Tool Launches

Mineralocity Aggregates Tool is Live

SALT LAKE CITY–(BUSINESS WIRE)–Mineralocity Aggregates is finally live! After years of development, our outstanding GIS team has completed the Mineralocity Aggregates tool. Mineralocity Aggregates was developed by Burgex Mining Consultants to be the leading platform for construction aggregate mineral market intelligence in the United States. Visit our new website at www.mineralocity.com to learn more.

“Our GIS team has taken thousands of data sets and designed a powerful tool that will change the industry.”

Tweet this

“This is a major accomplishment that will transform the aggregate industry and beyond,” said CEO Chris Summers of Burgex Inc. “Our GIS team has taken thousands of data sets and designed a powerful tool that will change the industry.”

The Mineralocity Aggregates platform will generate weeks or even months’ worth of actionable mineral market analysis research. This powerful platform enables local, regional and national construction aggregate producers to analyze current operations, select greenfield sites and develop long-term plans for growth. It’s a powerful tool for those in the business of producing construction aggregates, as well as those that support or invest in the industry.

Mineralocity isn’t only for aggregate producers. Mineralocity is an excellent tool for construction consultants, analysts, government agencies, sales, investors and mining professionals. This tool will provide users a location and estimated production for any producer across the country. If product costs or performance are tied to tonnage, geology or location, this tool allows access to better analyze and develop a new market. We look forward to working with you. Learn more at: www.mineralocity.com.